Jamaican vs Hungarian In Labor Force | Age 30-34
COMPARE
Jamaican
Hungarian
In Labor Force | Age 30-34
In Labor Force | Age 30-34 Comparison
Jamaicans
Hungarians
84.3%
IN LABOR FORCE | AGE 30-34
8.8/ 100
METRIC RATING
209th/ 347
METRIC RANK
84.5%
IN LABOR FORCE | AGE 30-34
24.8/ 100
METRIC RATING
191st/ 347
METRIC RANK
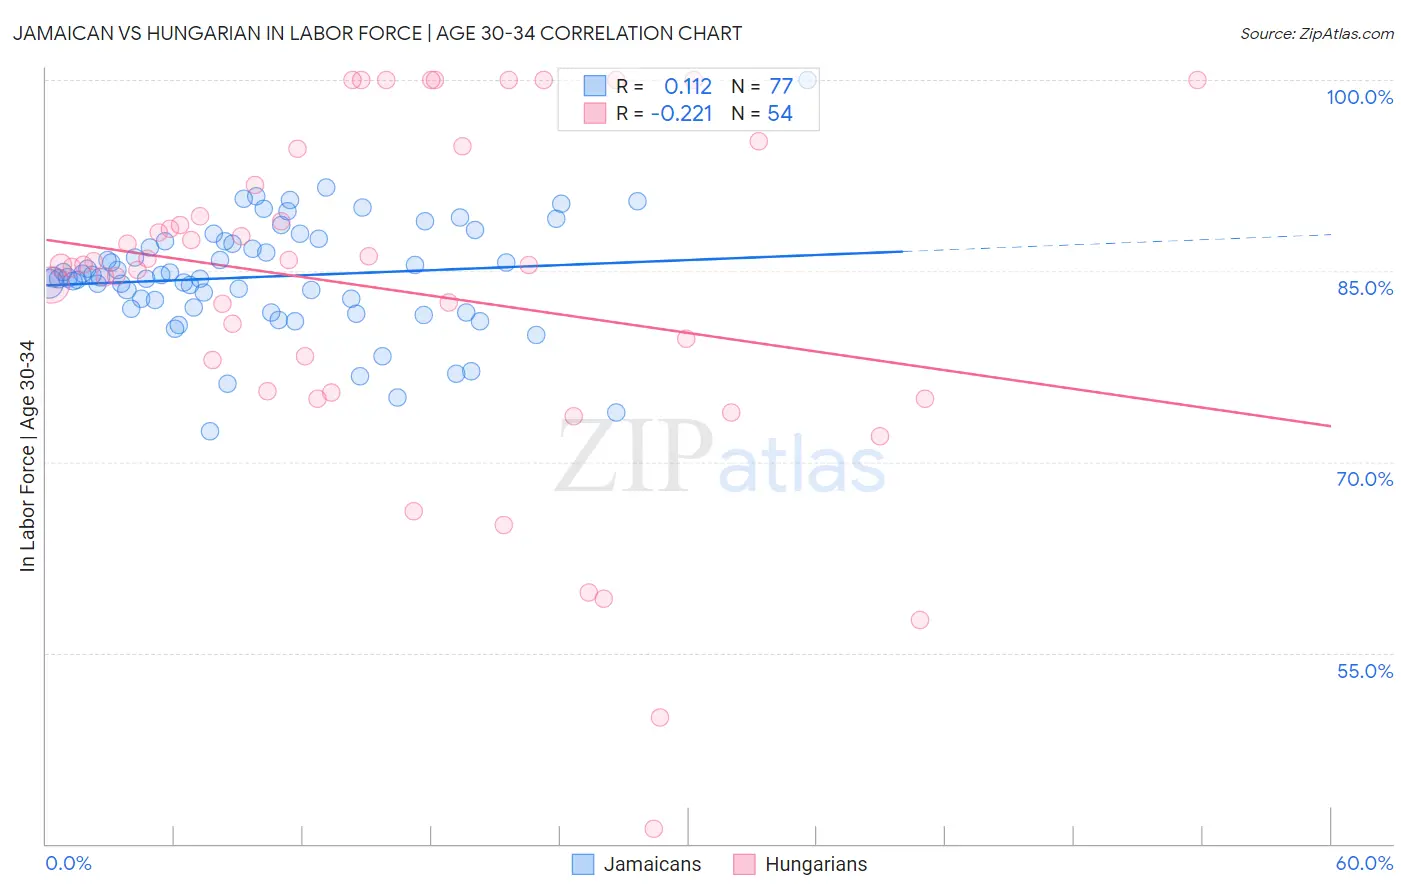
Jamaican vs Hungarian In Labor Force | Age 30-34 Correlation Chart
The statistical analysis conducted on geographies consisting of 367,736,864 people shows a poor positive correlation between the proportion of Jamaicans and labor force participation rate among population between the ages 30 and 34 in the United States with a correlation coefficient (R) of 0.112 and weighted average of 84.3%. Similarly, the statistical analysis conducted on geographies consisting of 485,743,554 people shows a weak negative correlation between the proportion of Hungarians and labor force participation rate among population between the ages 30 and 34 in the United States with a correlation coefficient (R) of -0.221 and weighted average of 84.5%, a difference of 0.22%.
In Labor Force | Age 30-34 Correlation Summary
| Measurement | Jamaican | Hungarian |
| Minimum | 72.4% | 41.2% |
| Maximum | 100.0% | 100.0% |
| Range | 27.6% | 58.8% |
| Mean | 84.6% | 83.5% |
| Median | 84.5% | 85.5% |
| Interquartile 25% (IQ1) | 82.1% | 75.6% |
| Interquartile 75% (IQ3) | 87.3% | 91.7% |
| Interquartile Range (IQR) | 5.3% | 16.1% |
| Standard Deviation (Sample) | 4.5% | 13.4% |
| Standard Deviation (Population) | 4.4% | 13.2% |
Demographics Similar to Jamaicans and Hungarians by In Labor Force | Age 30-34
In terms of in labor force | age 30-34, the demographic groups most similar to Jamaicans are Arab (84.3%, a difference of 0.0%), Indonesian (84.3%, a difference of 0.0%), Bangladeshi (84.3%, a difference of 0.010%), Lebanese (84.4%, a difference of 0.040%), and French (84.4%, a difference of 0.090%). Similarly, the demographic groups most similar to Hungarians are Scandinavian (84.5%, a difference of 0.0%), Immigrants from Zaire (84.5%, a difference of 0.010%), Immigrants from Costa Rica (84.5%, a difference of 0.010%), Immigrants from Afghanistan (84.5%, a difference of 0.010%), and Korean (84.5%, a difference of 0.020%).
| Demographics | Rating | Rank | In Labor Force | Age 30-34 |
| Immigrants | Zaire | 25.8 /100 | #190 | Fair 84.5% |
| Hungarians | 24.8 /100 | #191 | Fair 84.5% |
| Scandinavians | 24.7 /100 | #192 | Fair 84.5% |
| Immigrants | Costa Rica | 23.9 /100 | #193 | Fair 84.5% |
| Immigrants | Afghanistan | 23.5 /100 | #194 | Fair 84.5% |
| Koreans | 23.2 /100 | #195 | Fair 84.5% |
| British | 22.9 /100 | #196 | Fair 84.5% |
| Immigrants | Syria | 21.9 /100 | #197 | Fair 84.5% |
| Dutch | 20.2 /100 | #198 | Fair 84.5% |
| Immigrants | Thailand | 19.1 /100 | #199 | Poor 84.5% |
| Sub-Saharan Africans | 19.0 /100 | #200 | Poor 84.5% |
| Trinidadians and Tobagonians | 18.2 /100 | #201 | Poor 84.5% |
| Immigrants | West Indies | 18.1 /100 | #202 | Poor 84.5% |
| Canadians | 15.4 /100 | #203 | Poor 84.4% |
| Ecuadorians | 14.2 /100 | #204 | Poor 84.4% |
| French | 13.8 /100 | #205 | Poor 84.4% |
| Lebanese | 10.6 /100 | #206 | Poor 84.4% |
| Bangladeshis | 9.4 /100 | #207 | Tragic 84.3% |
| Arabs | 8.9 /100 | #208 | Tragic 84.3% |
| Jamaicans | 8.8 /100 | #209 | Tragic 84.3% |
| Indonesians | 8.8 /100 | #210 | Tragic 84.3% |