Jamaican vs Senegalese In Labor Force | Age 30-34
COMPARE
Jamaican
Senegalese
In Labor Force | Age 30-34
In Labor Force | Age 30-34 Comparison
Jamaicans
Senegalese
84.3%
IN LABOR FORCE | AGE 30-34
8.8/ 100
METRIC RATING
209th/ 347
METRIC RANK
85.4%
IN LABOR FORCE | AGE 30-34
99.4/ 100
METRIC RATING
65th/ 347
METRIC RANK
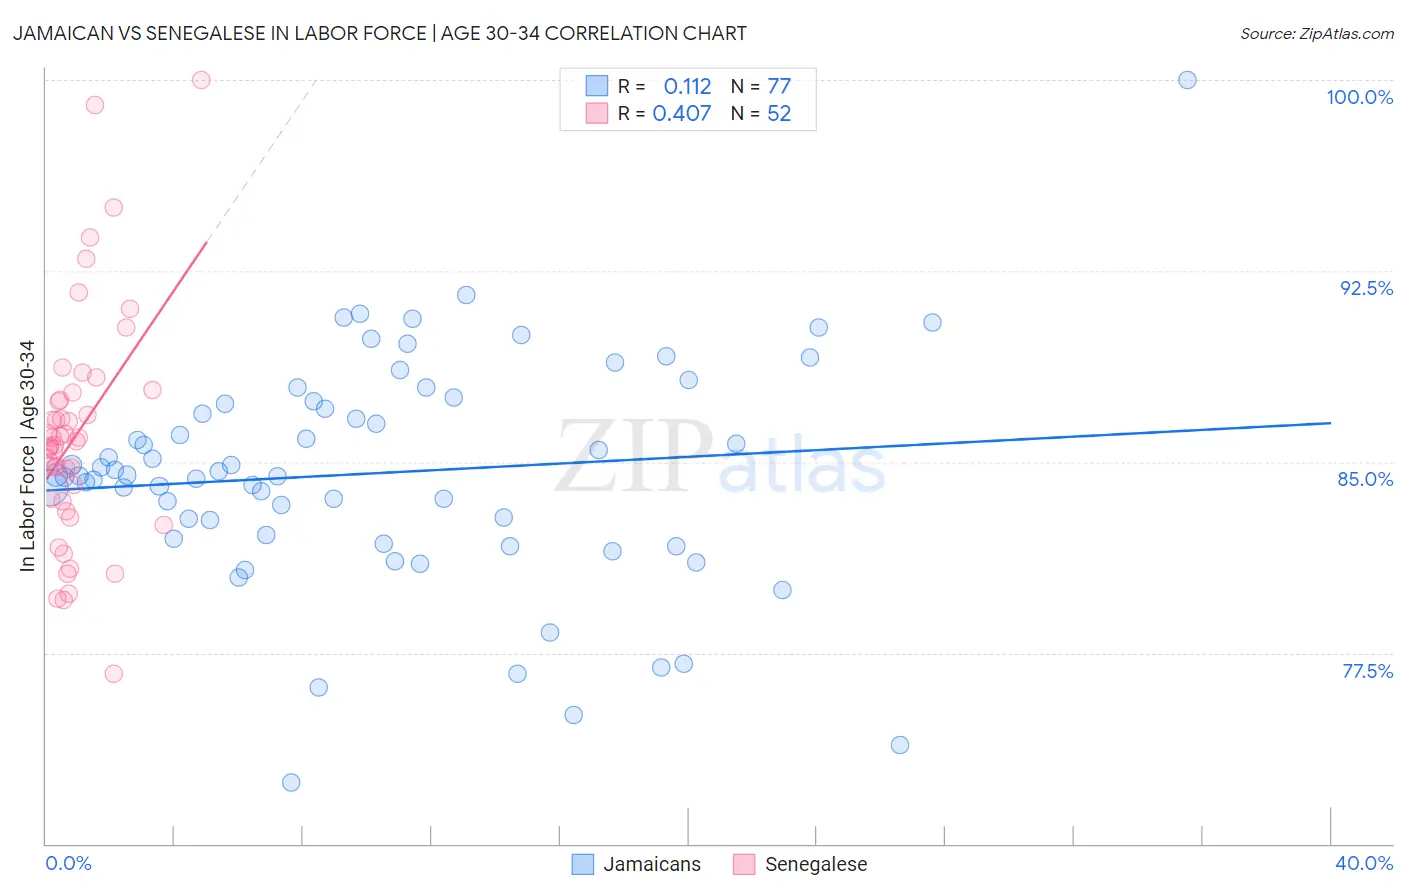
Jamaican vs Senegalese In Labor Force | Age 30-34 Correlation Chart
The statistical analysis conducted on geographies consisting of 367,736,864 people shows a poor positive correlation between the proportion of Jamaicans and labor force participation rate among population between the ages 30 and 34 in the United States with a correlation coefficient (R) of 0.112 and weighted average of 84.3%. Similarly, the statistical analysis conducted on geographies consisting of 78,106,128 people shows a moderate positive correlation between the proportion of Senegalese and labor force participation rate among population between the ages 30 and 34 in the United States with a correlation coefficient (R) of 0.407 and weighted average of 85.4%, a difference of 1.3%.
In Labor Force | Age 30-34 Correlation Summary
| Measurement | Jamaican | Senegalese |
| Minimum | 72.4% | 76.7% |
| Maximum | 100.0% | 100.0% |
| Range | 27.6% | 23.3% |
| Mean | 84.6% | 86.1% |
| Median | 84.5% | 85.7% |
| Interquartile 25% (IQ1) | 82.1% | 83.5% |
| Interquartile 75% (IQ3) | 87.3% | 87.6% |
| Interquartile Range (IQR) | 5.3% | 4.1% |
| Standard Deviation (Sample) | 4.5% | 4.5% |
| Standard Deviation (Population) | 4.4% | 4.5% |
Similar Demographics by In Labor Force | Age 30-34
Demographics Similar to Jamaicans by In Labor Force | Age 30-34
In terms of in labor force | age 30-34, the demographic groups most similar to Jamaicans are Arab (84.3%, a difference of 0.0%), Indonesian (84.3%, a difference of 0.0%), Japanese (84.3%, a difference of 0.0%), Bangladeshi (84.3%, a difference of 0.010%), and Immigrants from Western Asia (84.3%, a difference of 0.010%).
| Demographics | Rating | Rank | In Labor Force | Age 30-34 |
| Immigrants | West Indies | 18.1 /100 | #202 | Poor 84.5% |
| Canadians | 15.4 /100 | #203 | Poor 84.4% |
| Ecuadorians | 14.2 /100 | #204 | Poor 84.4% |
| French | 13.8 /100 | #205 | Poor 84.4% |
| Lebanese | 10.6 /100 | #206 | Poor 84.4% |
| Bangladeshis | 9.4 /100 | #207 | Tragic 84.3% |
| Arabs | 8.9 /100 | #208 | Tragic 84.3% |
| Jamaicans | 8.8 /100 | #209 | Tragic 84.3% |
| Indonesians | 8.8 /100 | #210 | Tragic 84.3% |
| Japanese | 8.8 /100 | #211 | Tragic 84.3% |
| Immigrants | Western Asia | 8.2 /100 | #212 | Tragic 84.3% |
| Immigrants | Jamaica | 7.9 /100 | #213 | Tragic 84.3% |
| Immigrants | Germany | 7.2 /100 | #214 | Tragic 84.3% |
| Europeans | 7.2 /100 | #215 | Tragic 84.3% |
| Immigrants | Ecuador | 7.1 /100 | #216 | Tragic 84.3% |
Demographics Similar to Senegalese by In Labor Force | Age 30-34
In terms of in labor force | age 30-34, the demographic groups most similar to Senegalese are Italian (85.4%, a difference of 0.0%), Macedonian (85.5%, a difference of 0.010%), Ghanaian (85.4%, a difference of 0.010%), Kenyan (85.4%, a difference of 0.010%), and Immigrants from Brazil (85.5%, a difference of 0.020%).
| Demographics | Rating | Rank | In Labor Force | Age 30-34 |
| Poles | 99.6 /100 | #58 | Exceptional 85.5% |
| Immigrants | Poland | 99.5 /100 | #59 | Exceptional 85.5% |
| Immigrants | France | 99.5 /100 | #60 | Exceptional 85.5% |
| Immigrants | Brazil | 99.5 /100 | #61 | Exceptional 85.5% |
| Soviet Union | 99.4 /100 | #62 | Exceptional 85.5% |
| Macedonians | 99.4 /100 | #63 | Exceptional 85.5% |
| Italians | 99.4 /100 | #64 | Exceptional 85.4% |
| Senegalese | 99.4 /100 | #65 | Exceptional 85.4% |
| Ghanaians | 99.4 /100 | #66 | Exceptional 85.4% |
| Kenyans | 99.3 /100 | #67 | Exceptional 85.4% |
| Immigrants | Eastern Europe | 99.3 /100 | #68 | Exceptional 85.4% |
| Immigrants | Iran | 99.2 /100 | #69 | Exceptional 85.4% |
| Brazilians | 99.1 /100 | #70 | Exceptional 85.4% |
| Immigrants | Japan | 99.1 /100 | #71 | Exceptional 85.4% |
| Immigrants | China | 99.0 /100 | #72 | Exceptional 85.4% |