Jamaican vs Chinese In Labor Force | Age 20-24
COMPARE
Jamaican
Chinese
In Labor Force | Age 20-24
In Labor Force | Age 20-24 Comparison
Jamaicans
Chinese
72.7%
IN LABOR FORCE | AGE 20-24
0.0/ 100
METRIC RATING
296th/ 347
METRIC RANK
77.3%
IN LABOR FORCE | AGE 20-24
100.0/ 100
METRIC RATING
49th/ 347
METRIC RANK
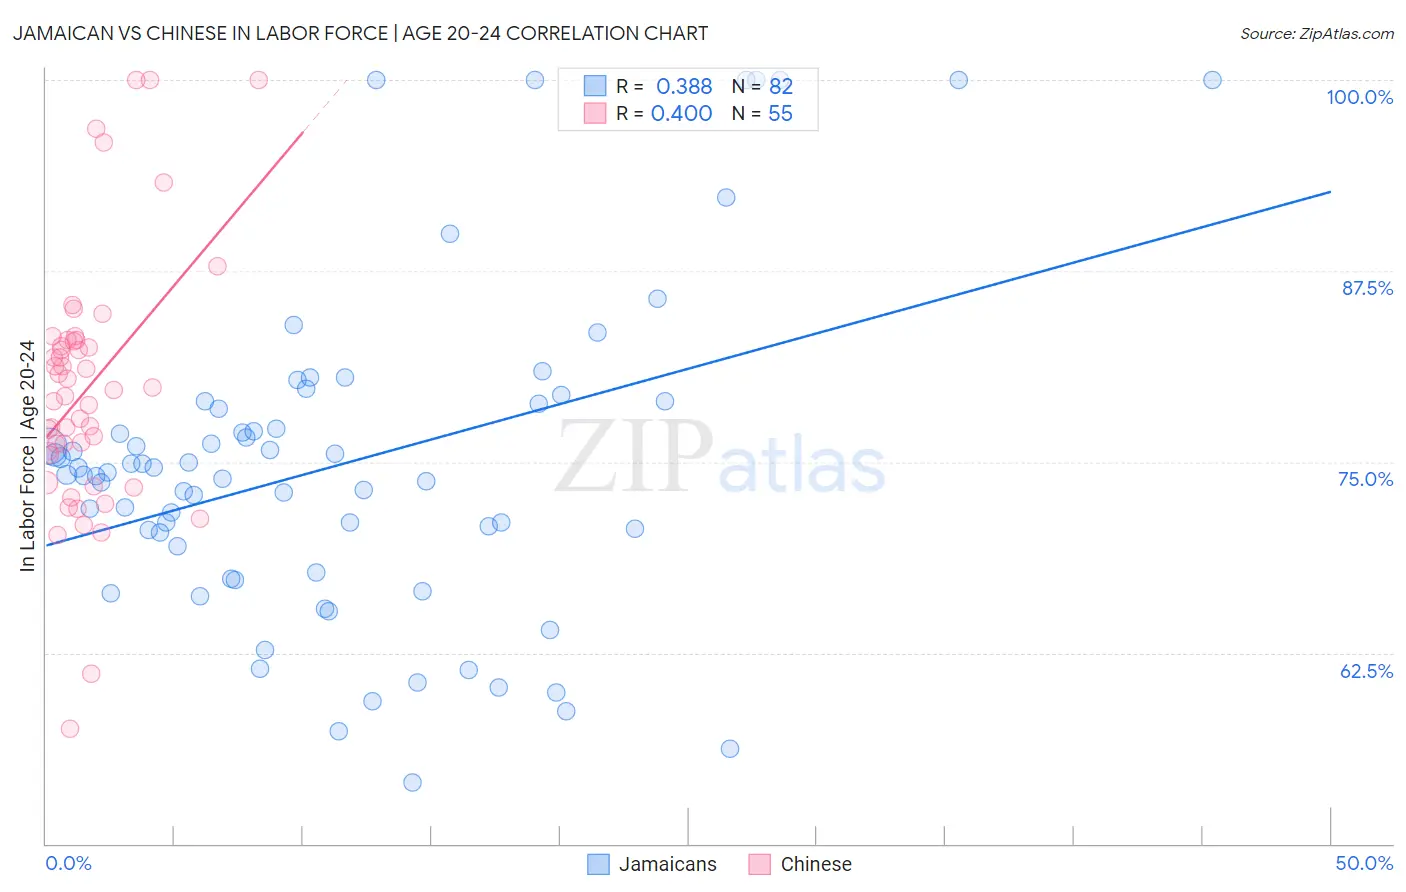
Jamaican vs Chinese In Labor Force | Age 20-24 Correlation Chart
The statistical analysis conducted on geographies consisting of 367,980,296 people shows a mild positive correlation between the proportion of Jamaicans and labor force participation rate among population between the ages 20 and 24 in the United States with a correlation coefficient (R) of 0.388 and weighted average of 72.7%. Similarly, the statistical analysis conducted on geographies consisting of 64,808,850 people shows a mild positive correlation between the proportion of Chinese and labor force participation rate among population between the ages 20 and 24 in the United States with a correlation coefficient (R) of 0.400 and weighted average of 77.3%, a difference of 6.2%.
In Labor Force | Age 20-24 Correlation Summary
| Measurement | Jamaican | Chinese |
| Minimum | 54.0% | 57.5% |
| Maximum | 100.0% | 100.0% |
| Range | 46.0% | 42.5% |
| Mean | 74.8% | 79.9% |
| Median | 74.2% | 79.7% |
| Interquartile 25% (IQ1) | 69.5% | 75.5% |
| Interquartile 75% (IQ3) | 78.8% | 83.0% |
| Interquartile Range (IQR) | 9.3% | 7.5% |
| Standard Deviation (Sample) | 10.6% | 8.4% |
| Standard Deviation (Population) | 10.5% | 8.4% |
Similar Demographics by In Labor Force | Age 20-24
Demographics Similar to Jamaicans by In Labor Force | Age 20-24
In terms of in labor force | age 20-24, the demographic groups most similar to Jamaicans are Okinawan (72.7%, a difference of 0.0%), Central American Indian (72.7%, a difference of 0.050%), Immigrants from Argentina (72.8%, a difference of 0.11%), Immigrants from Belize (72.8%, a difference of 0.14%), and Israeli (72.6%, a difference of 0.17%).
| Demographics | Rating | Rank | In Labor Force | Age 20-24 |
| U.S. Virgin Islanders | 0.1 /100 | #289 | Tragic 73.0% |
| Immigrants | Belarus | 0.1 /100 | #290 | Tragic 73.0% |
| Immigrants | Nicaragua | 0.0 /100 | #291 | Tragic 72.9% |
| Pueblo | 0.0 /100 | #292 | Tragic 72.9% |
| Immigrants | Belize | 0.0 /100 | #293 | Tragic 72.8% |
| Immigrants | Argentina | 0.0 /100 | #294 | Tragic 72.8% |
| Okinawans | 0.0 /100 | #295 | Tragic 72.7% |
| Jamaicans | 0.0 /100 | #296 | Tragic 72.7% |
| Central American Indians | 0.0 /100 | #297 | Tragic 72.7% |
| Israelis | 0.0 /100 | #298 | Tragic 72.6% |
| Iranians | 0.0 /100 | #299 | Tragic 72.6% |
| Armenians | 0.0 /100 | #300 | Tragic 72.5% |
| Cubans | 0.0 /100 | #301 | Tragic 72.5% |
| Natives/Alaskans | 0.0 /100 | #302 | Tragic 72.4% |
| Ecuadorians | 0.0 /100 | #303 | Tragic 72.4% |
Demographics Similar to Chinese by In Labor Force | Age 20-24
In terms of in labor force | age 20-24, the demographic groups most similar to Chinese are Serbian (77.3%, a difference of 0.010%), Malaysian (77.2%, a difference of 0.040%), Croatian (77.2%, a difference of 0.050%), Ethiopian (77.3%, a difference of 0.060%), and Indonesian (77.2%, a difference of 0.060%).
| Demographics | Rating | Rank | In Labor Force | Age 20-24 |
| French | 100.0 /100 | #42 | Exceptional 77.4% |
| Immigrants | Laos | 100.0 /100 | #43 | Exceptional 77.4% |
| Fijians | 100.0 /100 | #44 | Exceptional 77.4% |
| Native Hawaiians | 100.0 /100 | #45 | Exceptional 77.4% |
| Samoans | 100.0 /100 | #46 | Exceptional 77.4% |
| Ethiopians | 100.0 /100 | #47 | Exceptional 77.3% |
| Serbians | 100.0 /100 | #48 | Exceptional 77.3% |
| Chinese | 100.0 /100 | #49 | Exceptional 77.3% |
| Malaysians | 100.0 /100 | #50 | Exceptional 77.2% |
| Croatians | 100.0 /100 | #51 | Exceptional 77.2% |
| Indonesians | 100.0 /100 | #52 | Exceptional 77.2% |
| Immigrants | Azores | 100.0 /100 | #53 | Exceptional 77.2% |
| Celtics | 99.9 /100 | #54 | Exceptional 77.1% |
| Immigrants | Liberia | 99.9 /100 | #55 | Exceptional 77.1% |
| Europeans | 99.9 /100 | #56 | Exceptional 77.1% |