Immigrants from Colombia vs Chinese In Labor Force | Age 20-24
COMPARE
Immigrants from Colombia
Chinese
In Labor Force | Age 20-24
In Labor Force | Age 20-24 Comparison
Immigrants from Colombia
Chinese
73.4%
IN LABOR FORCE | AGE 20-24
0.2/ 100
METRIC RATING
274th/ 347
METRIC RANK
77.3%
IN LABOR FORCE | AGE 20-24
100.0/ 100
METRIC RATING
49th/ 347
METRIC RANK
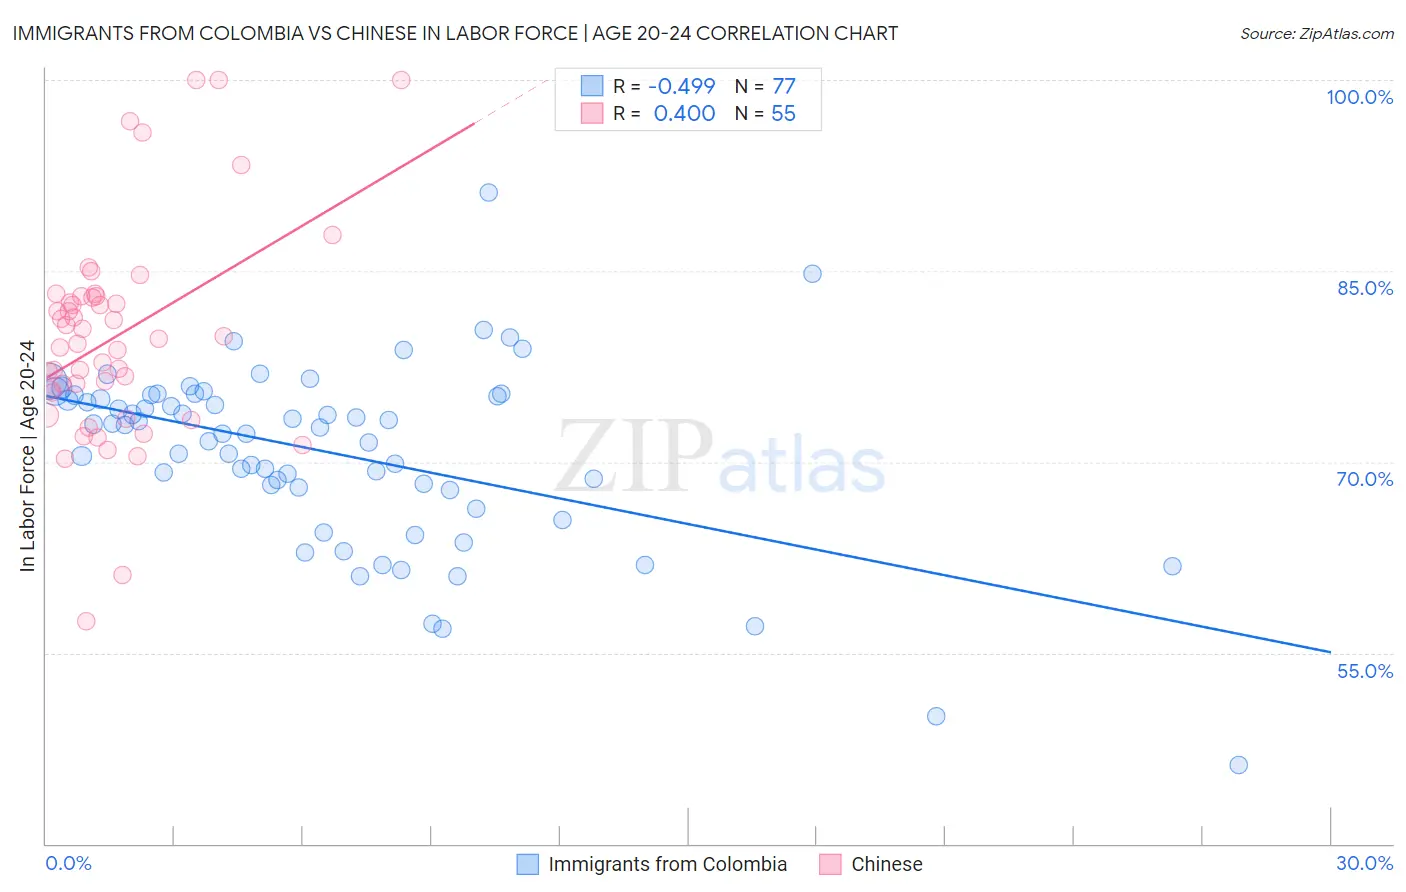
Immigrants from Colombia vs Chinese In Labor Force | Age 20-24 Correlation Chart
The statistical analysis conducted on geographies consisting of 378,565,425 people shows a moderate negative correlation between the proportion of Immigrants from Colombia and labor force participation rate among population between the ages 20 and 24 in the United States with a correlation coefficient (R) of -0.499 and weighted average of 73.4%. Similarly, the statistical analysis conducted on geographies consisting of 64,808,850 people shows a mild positive correlation between the proportion of Chinese and labor force participation rate among population between the ages 20 and 24 in the United States with a correlation coefficient (R) of 0.400 and weighted average of 77.3%, a difference of 5.3%.
In Labor Force | Age 20-24 Correlation Summary
| Measurement | Immigrants from Colombia | Chinese |
| Minimum | 46.2% | 57.5% |
| Maximum | 91.2% | 100.0% |
| Range | 45.0% | 42.5% |
| Mean | 70.7% | 79.9% |
| Median | 72.7% | 79.7% |
| Interquartile 25% (IQ1) | 67.9% | 75.5% |
| Interquartile 75% (IQ3) | 75.2% | 83.0% |
| Interquartile Range (IQR) | 7.3% | 7.5% |
| Standard Deviation (Sample) | 7.3% | 8.4% |
| Standard Deviation (Population) | 7.2% | 8.4% |
Similar Demographics by In Labor Force | Age 20-24
Demographics Similar to Immigrants from Colombia by In Labor Force | Age 20-24
In terms of in labor force | age 20-24, the demographic groups most similar to Immigrants from Colombia are Cheyenne (73.4%, a difference of 0.020%), Belizean (73.4%, a difference of 0.050%), Immigrants from South America (73.3%, a difference of 0.050%), Immigrants from Indonesia (73.4%, a difference of 0.060%), and Mongolian (73.3%, a difference of 0.070%).
| Demographics | Rating | Rank | In Labor Force | Age 20-24 |
| Immigrants | Western Asia | 0.4 /100 | #267 | Tragic 73.5% |
| South Americans | 0.4 /100 | #268 | Tragic 73.5% |
| Colombians | 0.3 /100 | #269 | Tragic 73.5% |
| Immigrants | Russia | 0.3 /100 | #270 | Tragic 73.5% |
| Immigrants | Indonesia | 0.3 /100 | #271 | Tragic 73.4% |
| Belizeans | 0.3 /100 | #272 | Tragic 73.4% |
| Cheyenne | 0.2 /100 | #273 | Tragic 73.4% |
| Immigrants | Colombia | 0.2 /100 | #274 | Tragic 73.4% |
| Immigrants | South America | 0.2 /100 | #275 | Tragic 73.3% |
| Mongolians | 0.2 /100 | #276 | Tragic 73.3% |
| Immigrants | Malaysia | 0.2 /100 | #277 | Tragic 73.3% |
| Cypriots | 0.2 /100 | #278 | Tragic 73.3% |
| Venezuelans | 0.2 /100 | #279 | Tragic 73.3% |
| Bahamians | 0.1 /100 | #280 | Tragic 73.3% |
| Immigrants | Venezuela | 0.1 /100 | #281 | Tragic 73.2% |
Demographics Similar to Chinese by In Labor Force | Age 20-24
In terms of in labor force | age 20-24, the demographic groups most similar to Chinese are Serbian (77.3%, a difference of 0.010%), Malaysian (77.2%, a difference of 0.040%), Croatian (77.2%, a difference of 0.050%), Ethiopian (77.3%, a difference of 0.060%), and Indonesian (77.2%, a difference of 0.060%).
| Demographics | Rating | Rank | In Labor Force | Age 20-24 |
| French | 100.0 /100 | #42 | Exceptional 77.4% |
| Immigrants | Laos | 100.0 /100 | #43 | Exceptional 77.4% |
| Fijians | 100.0 /100 | #44 | Exceptional 77.4% |
| Native Hawaiians | 100.0 /100 | #45 | Exceptional 77.4% |
| Samoans | 100.0 /100 | #46 | Exceptional 77.4% |
| Ethiopians | 100.0 /100 | #47 | Exceptional 77.3% |
| Serbians | 100.0 /100 | #48 | Exceptional 77.3% |
| Chinese | 100.0 /100 | #49 | Exceptional 77.3% |
| Malaysians | 100.0 /100 | #50 | Exceptional 77.2% |
| Croatians | 100.0 /100 | #51 | Exceptional 77.2% |
| Indonesians | 100.0 /100 | #52 | Exceptional 77.2% |
| Immigrants | Azores | 100.0 /100 | #53 | Exceptional 77.2% |
| Celtics | 99.9 /100 | #54 | Exceptional 77.1% |
| Immigrants | Liberia | 99.9 /100 | #55 | Exceptional 77.1% |
| Europeans | 99.9 /100 | #56 | Exceptional 77.1% |