Jamaican vs Immigrants from Ghana In Labor Force | Age 20-24
COMPARE
Jamaican
Immigrants from Ghana
In Labor Force | Age 20-24
In Labor Force | Age 20-24 Comparison
Jamaicans
Immigrants from Ghana
72.7%
IN LABOR FORCE | AGE 20-24
0.0/ 100
METRIC RATING
296th/ 347
METRIC RANK
74.5%
IN LABOR FORCE | AGE 20-24
12.7/ 100
METRIC RATING
215th/ 347
METRIC RANK
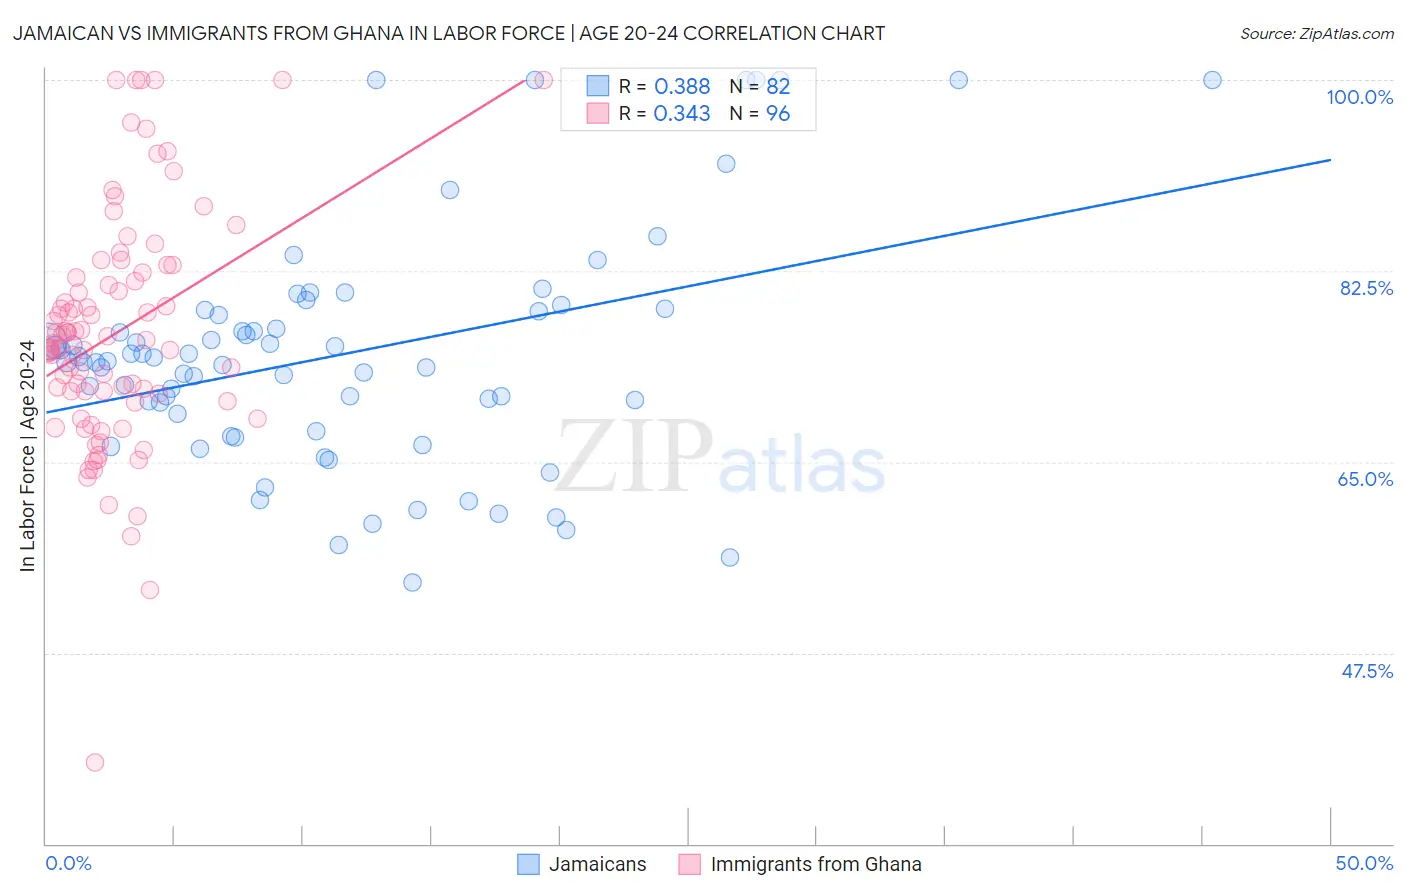
Jamaican vs Immigrants from Ghana In Labor Force | Age 20-24 Correlation Chart
The statistical analysis conducted on geographies consisting of 367,980,296 people shows a mild positive correlation between the proportion of Jamaicans and labor force participation rate among population between the ages 20 and 24 in the United States with a correlation coefficient (R) of 0.388 and weighted average of 72.7%. Similarly, the statistical analysis conducted on geographies consisting of 199,952,049 people shows a mild positive correlation between the proportion of Immigrants from Ghana and labor force participation rate among population between the ages 20 and 24 in the United States with a correlation coefficient (R) of 0.343 and weighted average of 74.5%, a difference of 2.5%.
In Labor Force | Age 20-24 Correlation Summary
| Measurement | Jamaican | Immigrants from Ghana |
| Minimum | 54.0% | 37.5% |
| Maximum | 100.0% | 100.0% |
| Range | 46.0% | 62.5% |
| Mean | 74.8% | 76.8% |
| Median | 74.2% | 76.0% |
| Interquartile 25% (IQ1) | 69.5% | 70.9% |
| Interquartile 75% (IQ3) | 78.8% | 82.1% |
| Interquartile Range (IQR) | 9.3% | 11.2% |
| Standard Deviation (Sample) | 10.6% | 10.8% |
| Standard Deviation (Population) | 10.5% | 10.8% |
Similar Demographics by In Labor Force | Age 20-24
Demographics Similar to Jamaicans by In Labor Force | Age 20-24
In terms of in labor force | age 20-24, the demographic groups most similar to Jamaicans are Okinawan (72.7%, a difference of 0.0%), Central American Indian (72.7%, a difference of 0.050%), Immigrants from Argentina (72.8%, a difference of 0.11%), Immigrants from Belize (72.8%, a difference of 0.14%), and Israeli (72.6%, a difference of 0.17%).
| Demographics | Rating | Rank | In Labor Force | Age 20-24 |
| U.S. Virgin Islanders | 0.1 /100 | #289 | Tragic 73.0% |
| Immigrants | Belarus | 0.1 /100 | #290 | Tragic 73.0% |
| Immigrants | Nicaragua | 0.0 /100 | #291 | Tragic 72.9% |
| Pueblo | 0.0 /100 | #292 | Tragic 72.9% |
| Immigrants | Belize | 0.0 /100 | #293 | Tragic 72.8% |
| Immigrants | Argentina | 0.0 /100 | #294 | Tragic 72.8% |
| Okinawans | 0.0 /100 | #295 | Tragic 72.7% |
| Jamaicans | 0.0 /100 | #296 | Tragic 72.7% |
| Central American Indians | 0.0 /100 | #297 | Tragic 72.7% |
| Israelis | 0.0 /100 | #298 | Tragic 72.6% |
| Iranians | 0.0 /100 | #299 | Tragic 72.6% |
| Armenians | 0.0 /100 | #300 | Tragic 72.5% |
| Cubans | 0.0 /100 | #301 | Tragic 72.5% |
| Natives/Alaskans | 0.0 /100 | #302 | Tragic 72.4% |
| Ecuadorians | 0.0 /100 | #303 | Tragic 72.4% |
Demographics Similar to Immigrants from Ghana by In Labor Force | Age 20-24
In terms of in labor force | age 20-24, the demographic groups most similar to Immigrants from Ghana are Immigrants from Kuwait (74.5%, a difference of 0.0%), Chilean (74.5%, a difference of 0.010%), Creek (74.5%, a difference of 0.020%), Peruvian (74.5%, a difference of 0.020%), and Immigrants from Southern Europe (74.5%, a difference of 0.020%).
| Demographics | Rating | Rank | In Labor Force | Age 20-24 |
| Immigrants | Uruguay | 15.8 /100 | #208 | Poor 74.6% |
| Arabs | 15.8 /100 | #209 | Poor 74.6% |
| Uruguayans | 15.1 /100 | #210 | Poor 74.6% |
| Immigrants | Australia | 14.7 /100 | #211 | Poor 74.6% |
| Creek | 13.3 /100 | #212 | Poor 74.5% |
| Peruvians | 13.3 /100 | #213 | Poor 74.5% |
| Immigrants | Southern Europe | 13.2 /100 | #214 | Poor 74.5% |
| Immigrants | Ghana | 12.7 /100 | #215 | Poor 74.5% |
| Immigrants | Kuwait | 12.7 /100 | #216 | Poor 74.5% |
| Chileans | 12.5 /100 | #217 | Poor 74.5% |
| Immigrants | Peru | 10.6 /100 | #218 | Poor 74.5% |
| Nepalese | 10.5 /100 | #219 | Poor 74.5% |
| Immigrants | Norway | 10.3 /100 | #220 | Poor 74.5% |
| Chickasaw | 10.3 /100 | #221 | Poor 74.5% |
| Immigrants | India | 9.9 /100 | #222 | Tragic 74.4% |