French American Indian vs Chinese In Labor Force | Age 20-24

COMPARE

French American Indian
Race
Ancestry
AfghanAfricanAlaska NativeAlaskan AthabascanAlbanianAleutAlsatianAmericanApacheArabArapahoArgentineanArmenianAssyrian/Chaldean/SyriacAustralianAustrianBahamianBangladeshiBarbadianBasqueBelgianBelizeanBermudanBhutaneseBlackfeetBolivianBrazilianBritishBritish West IndianBulgarianBurmeseCajunCambodianCanadianCape VerdeanCarpatho RusynCelticCentral AmericanCentral American IndianCherokeeCheyenneChickasawChileanChippewaChoctawColombianColvilleComancheCosta RicanCreeCreekCroatianCrowCubanCypriotCzechCzechoslovakianDanishDelawareDominicanDutchDutch West IndianEastern EuropeanEcuadorianEgyptianEnglishEstonianEthiopianEuropeanFijianFilipinoFinnishFrenchFrench American IndianFrench CanadianGermanGerman RussianGhanaianGreekGuamanian/ChamorroGuatemalanGuyaneseHaitianHmongHonduranHopiHoumaHungarianIcelanderIndian (Asian)IndonesianInupiatIranianIraqiIrishIroquoisIsraeliItalianJamaicanJapaneseJordanianKenyanKiowaKoreanLaotianLatvianLebaneseLiberianLithuanianLumbeeLuxembourgerMacedonianMalaysianMalteseMarshalleseMenomineeMexicanMexican American IndianMongolianMoroccanNative HawaiianNavajoNepaleseNew ZealanderNicaraguanNigerianNorthern EuropeanNorwegianOkinawanOsageOttawaPaiutePakistaniPalestinianPanamanianParaguayanPennsylvania GermanPeruvianPimaPolishPortuguesePotawatomiPuebloPuerto RicanPuget Sound SalishRomanianRussianSalvadoranSamoanScandinavianScotch-IrishScottishSeminoleSenegaleseSerbianShoshoneSierra LeoneanSiouxSlavicSlovakSloveneSomaliSouth AfricanSouth AmericanSouth American IndianSoviet UnionSpaniardSpanishSpanish AmericanSpanish American IndianSri LankanSubsaharan AfricanSudaneseSwedishSwissSyrianTaiwaneseThaiTlingit-HaidaTohono O'OdhamTonganTrinidadian and TobagonianTsimshianTurkishU.S. Virgin IslanderUgandanUkrainianUruguayanUteVenezuelanVietnameseWelshWest IndianYakamaYaquiYugoslavianYumanYup'ikZimbabwean
Immigration
NonimmigrantsImmigrantsAfghanistanAfricaAlbaniaArgentinaArmeniaAsiaAustraliaAustriaBahamasBangladeshBarbadosBelarusBelgiumBelizeBoliviaBosnia and HerzegovinaBrazilBulgariaBurma/MyanmarCabo VerdeCambodiaCameroonCanadaCaribbeanCentral AmericaChileChinaColombiaCongoCosta RicaCroatiaCubaCzechoslovakiaDenmarkDominicaDominican RepublicEastern AfricaEastern AsiaEastern EuropeEcuadorEgyptEl SalvadorEnglandEritreaEthiopiaEuropeFijiFranceGermanyGhanaGreeceGrenadaGuatemalaGuyanaHaitiHondurasHong KongHungaryIndiaIndonesiaIranIraqIrelandIsraelItalyJamaicaJapanJordanKazakhstanKenyaKoreaKuwaitLaosLatin AmericaLatviaLebanonLiberiaLithuaniaMalaysiaMexicoMicronesiaMiddle AfricaMoldovaMoroccoNepalNetherlandsNicaraguaNigeriaNorth AmericaNorth MacedoniaNorthern AfricaNorthern EuropeNorwayOceaniaPakistanPanamaPeruPhilippinesPolandPortugalRomaniaRussiaSaudi ArabiaScotlandSenegalSerbiaSierra LeoneSingaporeSomaliaSouth AfricaSouth AmericaSouth Central AsiaSouth Eastern AsiaSouthern EuropeSpainSri LankaSt. Vincent and the GrenadinesSudanSwedenSwitzerlandSyriaTaiwanThailandTrinidad and TobagoTurkeyUgandaUkraineUruguayUzbekistanVenezuelaVietnamWest IndiesWestern AfricaWestern AsiaWestern EuropeYemenZaireZimbabweAzores
Chinese
Race
Ancestry
AfghanAfricanAlaska NativeAlaskan AthabascanAlbanianAleutAlsatianAmericanApacheArabArapahoArgentineanArmenianAssyrian/Chaldean/SyriacAustralianAustrianBahamianBangladeshiBarbadianBasqueBelgianBelizeanBermudanBhutaneseBlackfeetBolivianBrazilianBritishBritish West IndianBulgarianBurmeseCajunCambodianCanadianCape VerdeanCarpatho RusynCelticCentral AmericanCentral American IndianCherokeeCheyenneChickasawChileanChineseChippewaChoctawColombianColvilleComancheCosta RicanCreeCreekCroatianCrowCubanCypriotCzechCzechoslovakianDanishDelawareDominicanDutchDutch West IndianEastern EuropeanEcuadorianEgyptianEnglishEstonianEthiopianEuropeanFijianFilipinoFinnishFrenchFrench CanadianGermanGerman RussianGhanaianGreekGuamanian/ChamorroGuatemalanGuyaneseHaitianHmongHonduranHopiHoumaHungarianIcelanderIndian (Asian)IndonesianInupiatIranianIraqiIrishIroquoisIsraeliItalianJamaicanJapaneseJordanianKenyanKiowaKoreanLaotianLatvianLebaneseLiberianLithuanianLumbeeLuxembourgerMacedonianMalaysianMalteseMarshalleseMenomineeMexicanMexican American IndianMongolianMoroccanNative HawaiianNavajoNepaleseNew ZealanderNicaraguanNigerianNorthern EuropeanNorwegianOkinawanOsageOttawaPaiutePakistaniPalestinianPanamanianParaguayanPennsylvania GermanPeruvianPimaPolishPortuguesePotawatomiPuebloPuerto RicanPuget Sound SalishRomanianRussianSalvadoranSamoanScandinavianScotch-IrishScottishSeminoleSenegaleseSerbianShoshoneSierra LeoneanSiouxSlavicSlovakSloveneSomaliSouth AfricanSouth AmericanSouth American IndianSoviet UnionSpaniardSpanishSpanish AmericanSpanish American IndianSri LankanSubsaharan AfricanSudaneseSwedishSwissSyrianTaiwaneseThaiTlingit-HaidaTohono O'OdhamTonganTrinidadian and TobagonianTsimshianTurkishU.S. Virgin IslanderUgandanUkrainianUruguayanUteVenezuelanVietnameseWelshWest IndianYakamaYaquiYugoslavianYumanYup'ikZimbabwean
Immigration
NonimmigrantsImmigrantsAfghanistanAfricaAlbaniaArgentinaArmeniaAsiaAustraliaAustriaBahamasBangladeshBarbadosBelarusBelgiumBelizeBoliviaBosnia and HerzegovinaBrazilBulgariaBurma/MyanmarCabo VerdeCambodiaCameroonCanadaCaribbeanCentral AmericaChileChinaColombiaCongoCosta RicaCroatiaCubaCzechoslovakiaDenmarkDominicaDominican RepublicEastern AfricaEastern AsiaEastern EuropeEcuadorEgyptEl SalvadorEnglandEritreaEthiopiaEuropeFijiFranceGermanyGhanaGreeceGrenadaGuatemalaGuyanaHaitiHondurasHong KongHungaryIndiaIndonesiaIranIraqIrelandIsraelItalyJamaicaJapanJordanKazakhstanKenyaKoreaKuwaitLaosLatin AmericaLatviaLebanonLiberiaLithuaniaMalaysiaMexicoMicronesiaMiddle AfricaMoldovaMoroccoNepalNetherlandsNicaraguaNigeriaNorth AmericaNorth MacedoniaNorthern AfricaNorthern EuropeNorwayOceaniaPakistanPanamaPeruPhilippinesPolandPortugalRomaniaRussiaSaudi ArabiaScotlandSenegalSerbiaSierra LeoneSingaporeSomaliaSouth AfricaSouth AmericaSouth Central AsiaSouth Eastern AsiaSouthern EuropeSpainSri LankaSt. Vincent and the GrenadinesSudanSwedenSwitzerlandSyriaTaiwanThailandTrinidad and TobagoTurkeyUgandaUkraineUruguayUzbekistanVenezuelaVietnamWest IndiesWestern AfricaWestern AsiaWestern EuropeYemenZaireZimbabweAzores
In Labor Force | Age 20-24
Income
Poverty
Unemployment
Labor Participation
Family Structure
Vehicle Availability
Education Level
Disability

In Labor Force | Age 20-24 Comparison

French American Indians

Chinese

Exceptional
Exceptional
76.8%
IN LABOR FORCE | AGE 20-24
99.8/ 100
METRIC RATING
68th/ 347
METRIC RANK
77.3%
IN LABOR FORCE | AGE 20-24
100.0/ 100
METRIC RATING
49th/ 347
METRIC RANK

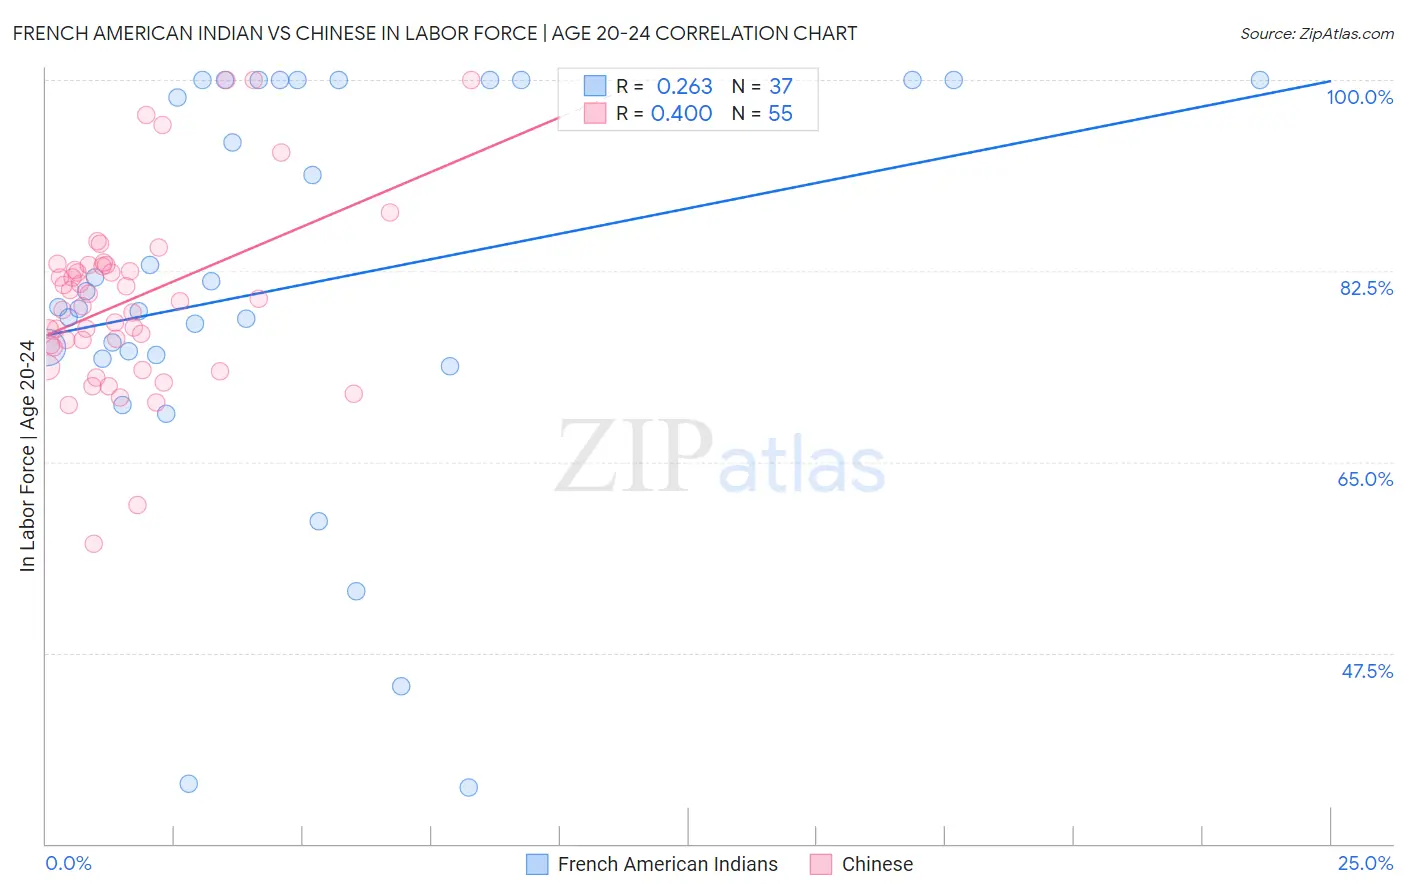
French American Indian vs Chinese In Labor Force | Age 20-24 Correlation Chart

The statistical analysis conducted on geographies consisting of 131,958,584 people shows a weak positive correlation between the proportion of French American Indians and labor force participation rate among population between the ages 20 and 24 in the United States with a correlation coefficient (R) of 0.263 and weighted average of 76.8%. Similarly, the statistical analysis conducted on geographies consisting of 64,808,850 people shows a mild positive correlation between the proportion of Chinese and labor force participation rate among population between the ages 20 and 24 in the United States with a correlation coefficient (R) of 0.400 and weighted average of 77.3%, a difference of 0.55%.
French American Indian vs Chinese In Labor Force | Age 20-24

In Labor Force | Age 20-24 Correlation Summary

MeasurementFrench American IndianChinese
Minimum35.1%57.5%
Maximum100.0%100.0%
Range64.9%42.5%
Mean81.1%79.9%
Median79.2%79.7%
Interquartile 25% (IQ1)74.6%75.5%
Interquartile 75% (IQ3)100.0%83.0%
Interquartile Range (IQR)25.4%7.5%
Standard Deviation (Sample)18.1%8.4%
Standard Deviation (Population)17.9%8.4%

Demographics Similar to French American Indians and Chinese by In Labor Force | Age 20-24

In terms of in labor force | age 20-24, the demographic groups most similar to French American Indians are Icelander (76.9%, a difference of 0.040%), Slavic (76.9%, a difference of 0.040%), Crow (76.9%, a difference of 0.060%), White/Caucasian (76.9%, a difference of 0.11%), and Immigrants from Kenya (77.0%, a difference of 0.15%). Similarly, the demographic groups most similar to Chinese are Serbian (77.3%, a difference of 0.010%), Malaysian (77.2%, a difference of 0.040%), Croatian (77.2%, a difference of 0.050%), Indonesian (77.2%, a difference of 0.060%), and Immigrants from the Azores (77.2%, a difference of 0.070%).
DemographicsRating | RankIn Labor Force | Age 20-24
Serbians
100.0
/100
|
#48
Exceptional
77.3%
Chinese
100.0
/100
|
#49
Exceptional
77.3%
Malaysians
100.0
/100
|
#50
Exceptional
77.2%
Croatians
100.0
/100
|
#51
Exceptional
77.2%
Indonesians
100.0
/100
|
#52
Exceptional
77.2%
Immigrants | Azores
100.0
/100
|
#53
Exceptional
77.2%
Celtics
99.9
/100
|
#54
Exceptional
77.1%
Immigrants | Liberia
99.9
/100
|
#55
Exceptional
77.1%
Europeans
99.9
/100
|
#56
Exceptional
77.1%
Chippewa
99.9
/100
|
#57
Exceptional
77.1%
Hawaiians
99.9
/100
|
#58
Exceptional
77.0%
Scotch-Irish
99.9
/100
|
#59
Exceptional
77.0%
Kenyans
99.9
/100
|
#60
Exceptional
77.0%
Immigrants | Eritrea
99.9
/100
|
#61
Exceptional
77.0%
Immigrants | Kenya
99.9
/100
|
#62
Exceptional
77.0%
Lithuanians
99.9
/100
|
#63
Exceptional
77.0%
Whites/Caucasians
99.9
/100
|
#64
Exceptional
76.9%
Crow
99.9
/100
|
#65
Exceptional
76.9%
Icelanders
99.9
/100
|
#66
Exceptional
76.9%
Slavs
99.9
/100
|
#67
Exceptional
76.9%
French American Indians
99.8
/100
|
#68
Exceptional
76.8%