Irish vs Immigrants from Eastern Asia In Labor Force | Age 20-64
COMPARE
Irish
Immigrants from Eastern Asia
In Labor Force | Age 20-64
In Labor Force | Age 20-64 Comparison
Irish
Immigrants from Eastern Asia
79.3%
IN LABOR FORCE | AGE 20-64
13.2/ 100
METRIC RATING
212th/ 347
METRIC RANK
79.9%
IN LABOR FORCE | AGE 20-64
89.4/ 100
METRIC RATING
128th/ 347
METRIC RANK
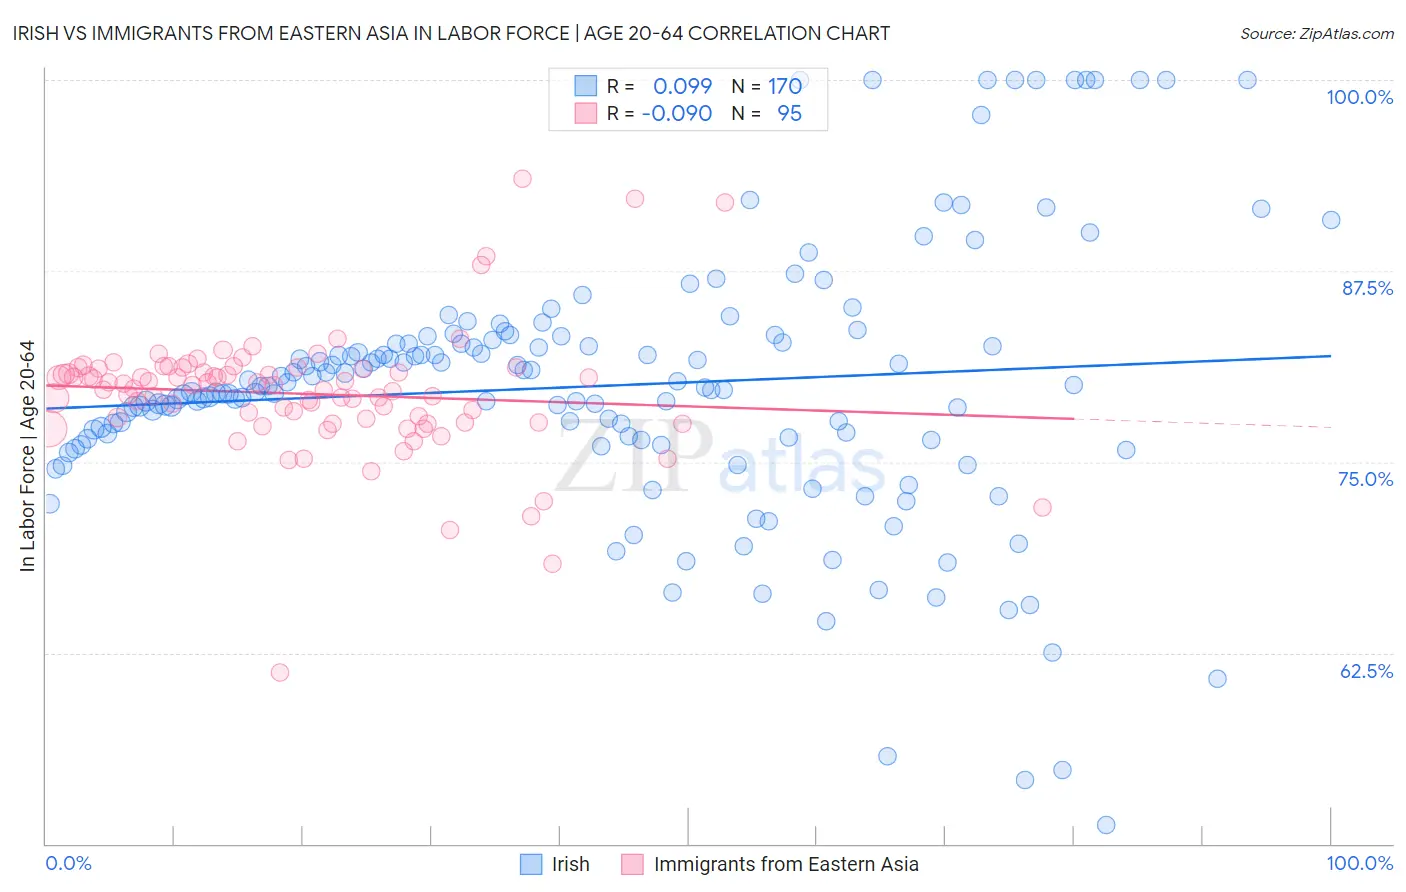
Irish vs Immigrants from Eastern Asia In Labor Force | Age 20-64 Correlation Chart
The statistical analysis conducted on geographies consisting of 580,689,060 people shows a slight positive correlation between the proportion of Irish and labor force participation rate among population between the ages 20 and 64 in the United States with a correlation coefficient (R) of 0.099 and weighted average of 79.3%. Similarly, the statistical analysis conducted on geographies consisting of 499,970,956 people shows a slight negative correlation between the proportion of Immigrants from Eastern Asia and labor force participation rate among population between the ages 20 and 64 in the United States with a correlation coefficient (R) of -0.090 and weighted average of 79.9%, a difference of 0.81%.
In Labor Force | Age 20-64 Correlation Summary
| Measurement | Irish | Immigrants from Eastern Asia |
| Minimum | 51.2% | 61.2% |
| Maximum | 100.0% | 93.5% |
| Range | 48.8% | 32.3% |
| Mean | 80.0% | 79.5% |
| Median | 79.9% | 80.0% |
| Interquartile 25% (IQ1) | 76.5% | 77.6% |
| Interquartile 75% (IQ3) | 82.8% | 81.1% |
| Interquartile Range (IQR) | 6.3% | 3.5% |
| Standard Deviation (Sample) | 8.8% | 4.2% |
| Standard Deviation (Population) | 8.8% | 4.2% |
Similar Demographics by In Labor Force | Age 20-64
Demographics Similar to Irish by In Labor Force | Age 20-64
In terms of in labor force | age 20-64, the demographic groups most similar to Irish are Immigrants from Portugal (79.3%, a difference of 0.010%), Immigrants from Armenia (79.2%, a difference of 0.020%), Immigrants from Norway (79.2%, a difference of 0.020%), Arab (79.2%, a difference of 0.030%), and European (79.3%, a difference of 0.040%).
| Demographics | Rating | Rank | In Labor Force | Age 20-64 |
| Immigrants | Congo | 17.5 /100 | #205 | Poor 79.3% |
| Immigrants | Ecuador | 16.9 /100 | #206 | Poor 79.3% |
| Sub-Saharan Africans | 16.5 /100 | #207 | Poor 79.3% |
| British | 16.5 /100 | #208 | Poor 79.3% |
| Bangladeshis | 16.4 /100 | #209 | Poor 79.3% |
| Haitians | 16.1 /100 | #210 | Poor 79.3% |
| Europeans | 15.3 /100 | #211 | Poor 79.3% |
| Irish | 13.2 /100 | #212 | Poor 79.3% |
| Immigrants | Portugal | 12.8 /100 | #213 | Poor 79.3% |
| Immigrants | Armenia | 12.2 /100 | #214 | Poor 79.2% |
| Immigrants | Norway | 12.0 /100 | #215 | Poor 79.2% |
| Arabs | 11.4 /100 | #216 | Poor 79.2% |
| Immigrants | Western Asia | 11.0 /100 | #217 | Poor 79.2% |
| Immigrants | England | 9.3 /100 | #218 | Tragic 79.2% |
| French Canadians | 8.4 /100 | #219 | Tragic 79.2% |
Demographics Similar to Immigrants from Eastern Asia by In Labor Force | Age 20-64
In terms of in labor force | age 20-64, the demographic groups most similar to Immigrants from Eastern Asia are Immigrants from Czechoslovakia (79.9%, a difference of 0.010%), Italian (79.9%, a difference of 0.010%), Immigrants from Zaire (79.9%, a difference of 0.020%), Immigrants from Iran (79.9%, a difference of 0.020%), and Immigrants from France (79.9%, a difference of 0.030%).
| Demographics | Rating | Rank | In Labor Force | Age 20-64 |
| Immigrants | Kuwait | 92.2 /100 | #121 | Exceptional 80.0% |
| Mongolians | 92.0 /100 | #122 | Exceptional 79.9% |
| Immigrants | Russia | 91.8 /100 | #123 | Exceptional 79.9% |
| Immigrants | Europe | 91.6 /100 | #124 | Exceptional 79.9% |
| Danes | 91.5 /100 | #125 | Exceptional 79.9% |
| Immigrants | France | 90.7 /100 | #126 | Exceptional 79.9% |
| Immigrants | Czechoslovakia | 89.7 /100 | #127 | Excellent 79.9% |
| Immigrants | Eastern Asia | 89.4 /100 | #128 | Excellent 79.9% |
| Italians | 88.9 /100 | #129 | Excellent 79.9% |
| Immigrants | Zaire | 88.6 /100 | #130 | Excellent 79.9% |
| Immigrants | Iran | 88.3 /100 | #131 | Excellent 79.9% |
| Indians (Asian) | 87.7 /100 | #132 | Excellent 79.9% |
| South American Indians | 87.6 /100 | #133 | Excellent 79.9% |
| Belgians | 87.4 /100 | #134 | Excellent 79.9% |
| Ukrainians | 86.8 /100 | #135 | Excellent 79.9% |