Yugoslavian vs Finnish In Labor Force | Age 20-64
COMPARE
Yugoslavian
Finnish
In Labor Force | Age 20-64
In Labor Force | Age 20-64 Comparison
Yugoslavians
Finns
80.1%
IN LABOR FORCE | AGE 20-64
95.9/ 100
METRIC RATING
95th/ 347
METRIC RANK
79.5%
IN LABOR FORCE | AGE 20-64
35.9/ 100
METRIC RATING
184th/ 347
METRIC RANK
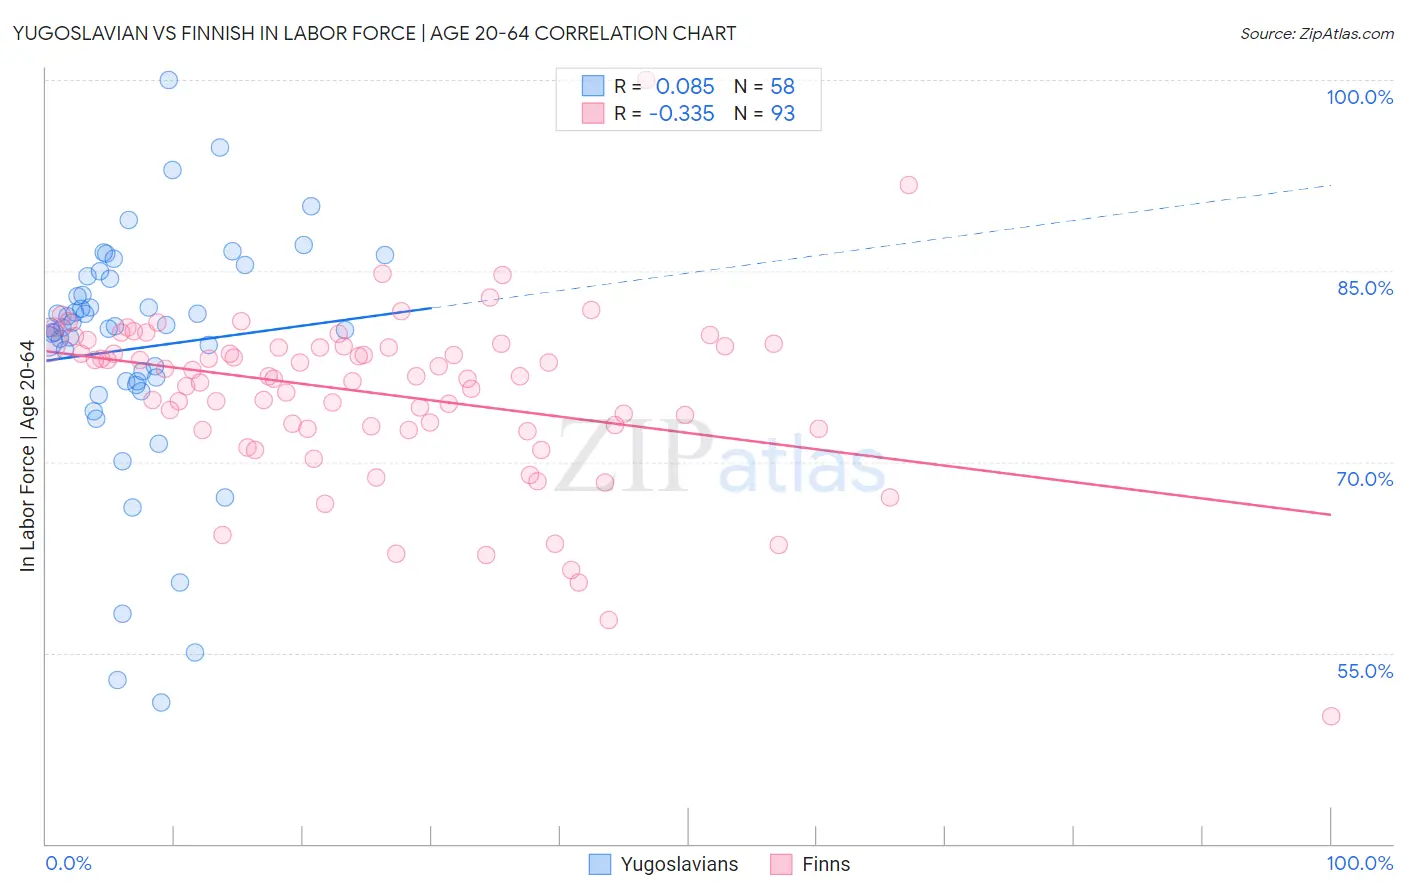
Yugoslavian vs Finnish In Labor Force | Age 20-64 Correlation Chart
The statistical analysis conducted on geographies consisting of 285,716,744 people shows a slight positive correlation between the proportion of Yugoslavians and labor force participation rate among population between the ages 20 and 64 in the United States with a correlation coefficient (R) of 0.085 and weighted average of 80.1%. Similarly, the statistical analysis conducted on geographies consisting of 404,683,830 people shows a mild negative correlation between the proportion of Finns and labor force participation rate among population between the ages 20 and 64 in the United States with a correlation coefficient (R) of -0.335 and weighted average of 79.5%, a difference of 0.75%.
In Labor Force | Age 20-64 Correlation Summary
| Measurement | Yugoslavian | Finnish |
| Minimum | 51.1% | 50.0% |
| Maximum | 100.0% | 100.0% |
| Range | 48.9% | 50.0% |
| Mean | 78.9% | 75.4% |
| Median | 80.5% | 76.7% |
| Interquartile 25% (IQ1) | 76.3% | 72.6% |
| Interquartile 75% (IQ3) | 84.3% | 79.2% |
| Interquartile Range (IQR) | 8.0% | 6.5% |
| Standard Deviation (Sample) | 9.4% | 6.9% |
| Standard Deviation (Population) | 9.3% | 6.8% |
Similar Demographics by In Labor Force | Age 20-64
Demographics Similar to Yugoslavians by In Labor Force | Age 20-64
In terms of in labor force | age 20-64, the demographic groups most similar to Yugoslavians are Immigrants from Malaysia (80.1%, a difference of 0.0%), South American (80.1%, a difference of 0.0%), Immigrants from Uruguay (80.1%, a difference of 0.0%), Immigrants from Asia (80.1%, a difference of 0.010%), and Immigrants from Chile (80.1%, a difference of 0.010%).
| Demographics | Rating | Rank | In Labor Force | Age 20-64 |
| Chileans | 97.0 /100 | #88 | Exceptional 80.1% |
| Immigrants | Venezuela | 96.8 /100 | #89 | Exceptional 80.1% |
| Poles | 96.8 /100 | #90 | Exceptional 80.1% |
| Uruguayans | 96.7 /100 | #91 | Exceptional 80.1% |
| Ghanaians | 96.7 /100 | #92 | Exceptional 80.1% |
| Immigrants | Belarus | 96.4 /100 | #93 | Exceptional 80.1% |
| Immigrants | Asia | 96.0 /100 | #94 | Exceptional 80.1% |
| Yugoslavians | 95.9 /100 | #95 | Exceptional 80.1% |
| Immigrants | Malaysia | 95.9 /100 | #96 | Exceptional 80.1% |
| South Americans | 95.9 /100 | #97 | Exceptional 80.1% |
| Immigrants | Uruguay | 95.8 /100 | #98 | Exceptional 80.1% |
| Immigrants | Chile | 95.7 /100 | #99 | Exceptional 80.1% |
| Filipinos | 95.6 /100 | #100 | Exceptional 80.1% |
| Palestinians | 95.5 /100 | #101 | Exceptional 80.0% |
| Immigrants | Australia | 95.5 /100 | #102 | Exceptional 80.0% |
Demographics Similar to Finns by In Labor Force | Age 20-64
In terms of in labor force | age 20-64, the demographic groups most similar to Finns are Malaysian (79.5%, a difference of 0.010%), Immigrants from Hungary (79.5%, a difference of 0.010%), Israeli (79.5%, a difference of 0.010%), Northern European (79.5%, a difference of 0.010%), and Immigrants from Saudi Arabia (79.5%, a difference of 0.020%).
| Demographics | Rating | Rank | In Labor Force | Age 20-64 |
| Immigrants | Netherlands | 45.2 /100 | #177 | Average 79.5% |
| Czechoslovakians | 44.3 /100 | #178 | Average 79.5% |
| Armenians | 41.4 /100 | #179 | Average 79.5% |
| Salvadorans | 41.0 /100 | #180 | Average 79.5% |
| Immigrants | Saudi Arabia | 37.7 /100 | #181 | Fair 79.5% |
| Malaysians | 37.1 /100 | #182 | Fair 79.5% |
| Immigrants | Hungary | 36.8 /100 | #183 | Fair 79.5% |
| Finns | 35.9 /100 | #184 | Fair 79.5% |
| Israelis | 34.7 /100 | #185 | Fair 79.5% |
| Northern Europeans | 34.5 /100 | #186 | Fair 79.5% |
| Assyrians/Chaldeans/Syriacs | 33.3 /100 | #187 | Fair 79.4% |
| Immigrants | Haiti | 32.1 /100 | #188 | Fair 79.4% |
| Immigrants | El Salvador | 30.9 /100 | #189 | Fair 79.4% |
| Immigrants | Syria | 30.8 /100 | #190 | Fair 79.4% |
| Swiss | 28.9 /100 | #191 | Fair 79.4% |