Immigrants from Portugal vs Aleut In Labor Force | Age 16-19
COMPARE
Immigrants from Portugal
Aleut
In Labor Force | Age 16-19
In Labor Force | Age 16-19 Comparison
Immigrants from Portugal
Aleuts
39.7%
IN LABOR FORCE | AGE 16-19
99.9/ 100
METRIC RATING
77th/ 347
METRIC RANK
40.4%
IN LABOR FORCE | AGE 16-19
100.0/ 100
METRIC RATING
58th/ 347
METRIC RANK
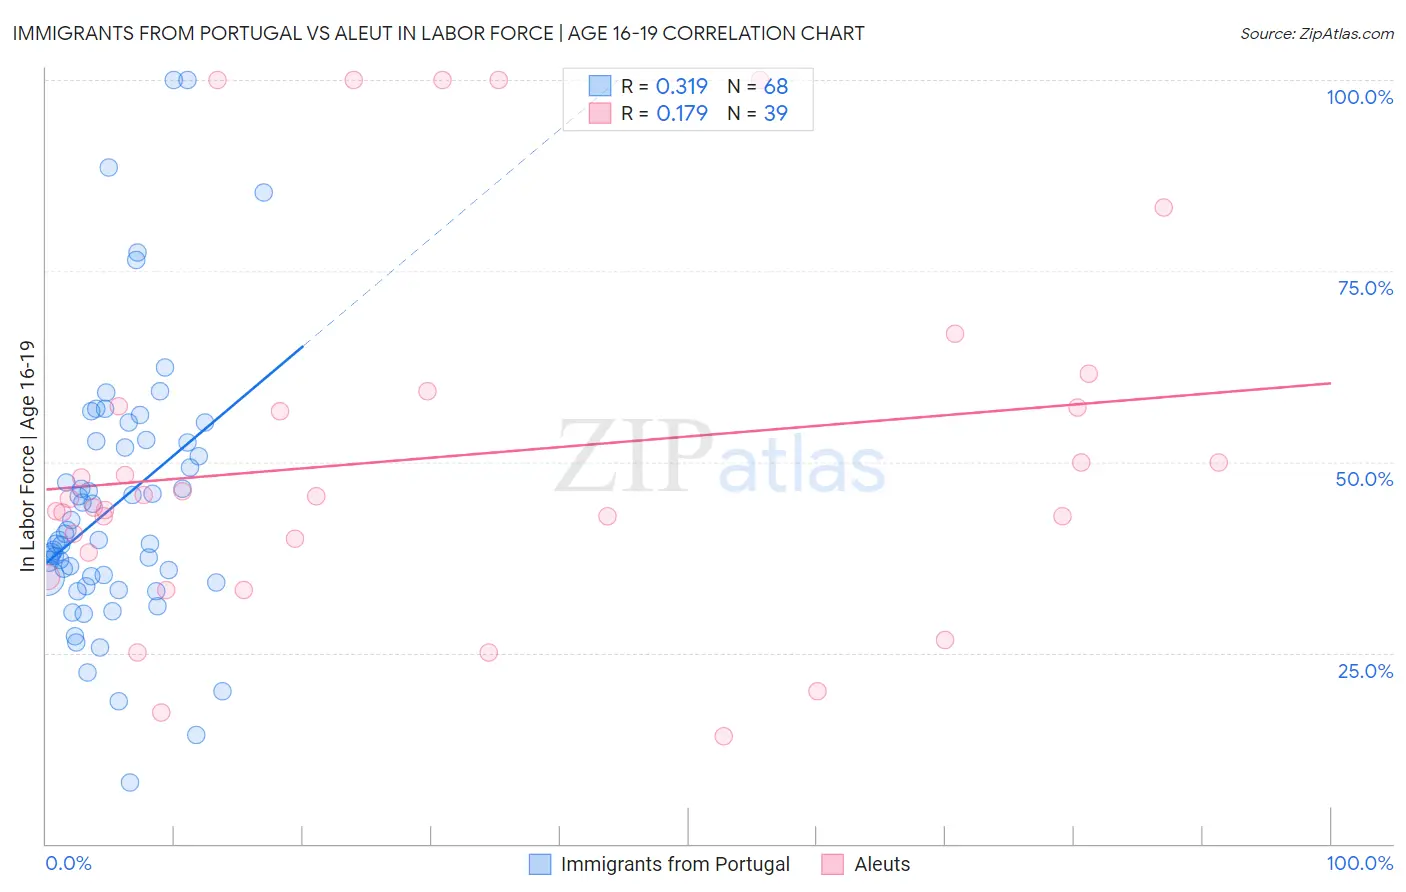
Immigrants from Portugal vs Aleut In Labor Force | Age 16-19 Correlation Chart
The statistical analysis conducted on geographies consisting of 174,562,650 people shows a mild positive correlation between the proportion of Immigrants from Portugal and labor force participation rate among population between the ages 16 and 19 in the United States with a correlation coefficient (R) of 0.319 and weighted average of 39.7%. Similarly, the statistical analysis conducted on geographies consisting of 61,744,567 people shows a poor positive correlation between the proportion of Aleuts and labor force participation rate among population between the ages 16 and 19 in the United States with a correlation coefficient (R) of 0.179 and weighted average of 40.4%, a difference of 1.9%.
In Labor Force | Age 16-19 Correlation Summary
| Measurement | Immigrants from Portugal | Aleut |
| Minimum | 8.0% | 14.1% |
| Maximum | 100.0% | 100.0% |
| Range | 92.0% | 85.9% |
| Mean | 44.4% | 50.6% |
| Median | 39.8% | 45.1% |
| Interquartile 25% (IQ1) | 34.5% | 38.2% |
| Interquartile 75% (IQ3) | 52.6% | 57.3% |
| Interquartile Range (IQR) | 18.1% | 19.1% |
| Standard Deviation (Sample) | 17.8% | 23.4% |
| Standard Deviation (Population) | 17.6% | 23.1% |
Demographics Similar to Immigrants from Portugal and Aleuts by In Labor Force | Age 16-19
In terms of in labor force | age 16-19, the demographic groups most similar to Immigrants from Portugal are Malaysian (39.7%, a difference of 0.13%), French American Indian (39.8%, a difference of 0.40%), Hungarian (39.8%, a difference of 0.42%), Immigrants from Middle Africa (39.9%, a difference of 0.65%), and Serbian (39.9%, a difference of 0.69%). Similarly, the demographic groups most similar to Aleuts are Lithuanian (40.4%, a difference of 0.010%), Slavic (40.4%, a difference of 0.13%), Immigrants from Eastern Africa (40.4%, a difference of 0.18%), American (40.3%, a difference of 0.33%), and Cherokee (40.2%, a difference of 0.47%).
| Demographics | Rating | Rank | In Labor Force | Age 16-19 |
| Lithuanians | 100.0 /100 | #57 | Exceptional 40.4% |
| Aleuts | 100.0 /100 | #58 | Exceptional 40.4% |
| Slavs | 100.0 /100 | #59 | Exceptional 40.4% |
| Immigrants | Eastern Africa | 100.0 /100 | #60 | Exceptional 40.4% |
| Americans | 100.0 /100 | #61 | Exceptional 40.3% |
| Cherokee | 100.0 /100 | #62 | Exceptional 40.2% |
| Northern Europeans | 100.0 /100 | #63 | Exceptional 40.2% |
| Immigrants | Micronesia | 100.0 /100 | #64 | Exceptional 40.2% |
| Kenyans | 100.0 /100 | #65 | Exceptional 40.1% |
| Immigrants | Nonimmigrants | 100.0 /100 | #66 | Exceptional 40.1% |
| Canadians | 100.0 /100 | #67 | Exceptional 40.1% |
| Italians | 99.9 /100 | #68 | Exceptional 40.1% |
| Potawatomi | 99.9 /100 | #69 | Exceptional 40.0% |
| Portuguese | 99.9 /100 | #70 | Exceptional 40.0% |
| Serbians | 99.9 /100 | #71 | Exceptional 39.9% |
| Iroquois | 99.9 /100 | #72 | Exceptional 39.9% |
| Immigrants | Middle Africa | 99.9 /100 | #73 | Exceptional 39.9% |
| Hungarians | 99.9 /100 | #74 | Exceptional 39.8% |
| French American Indians | 99.9 /100 | #75 | Exceptional 39.8% |
| Malaysians | 99.9 /100 | #76 | Exceptional 39.7% |
| Immigrants | Portugal | 99.9 /100 | #77 | Exceptional 39.7% |