Immigrants vs Immigrants from Indonesia In Labor Force | Age > 16
COMPARE
Immigrants
Immigrants from Indonesia
In Labor Force | Age > 16
In Labor Force | Age > 16 Comparison
Immigrants
Immigrants from Indonesia
65.4%
IN LABOR FORCE | AGE > 16
81.9/ 100
METRIC RATING
150th/ 347
METRIC RANK
65.7%
IN LABOR FORCE | AGE > 16
96.8/ 100
METRIC RATING
115th/ 347
METRIC RANK
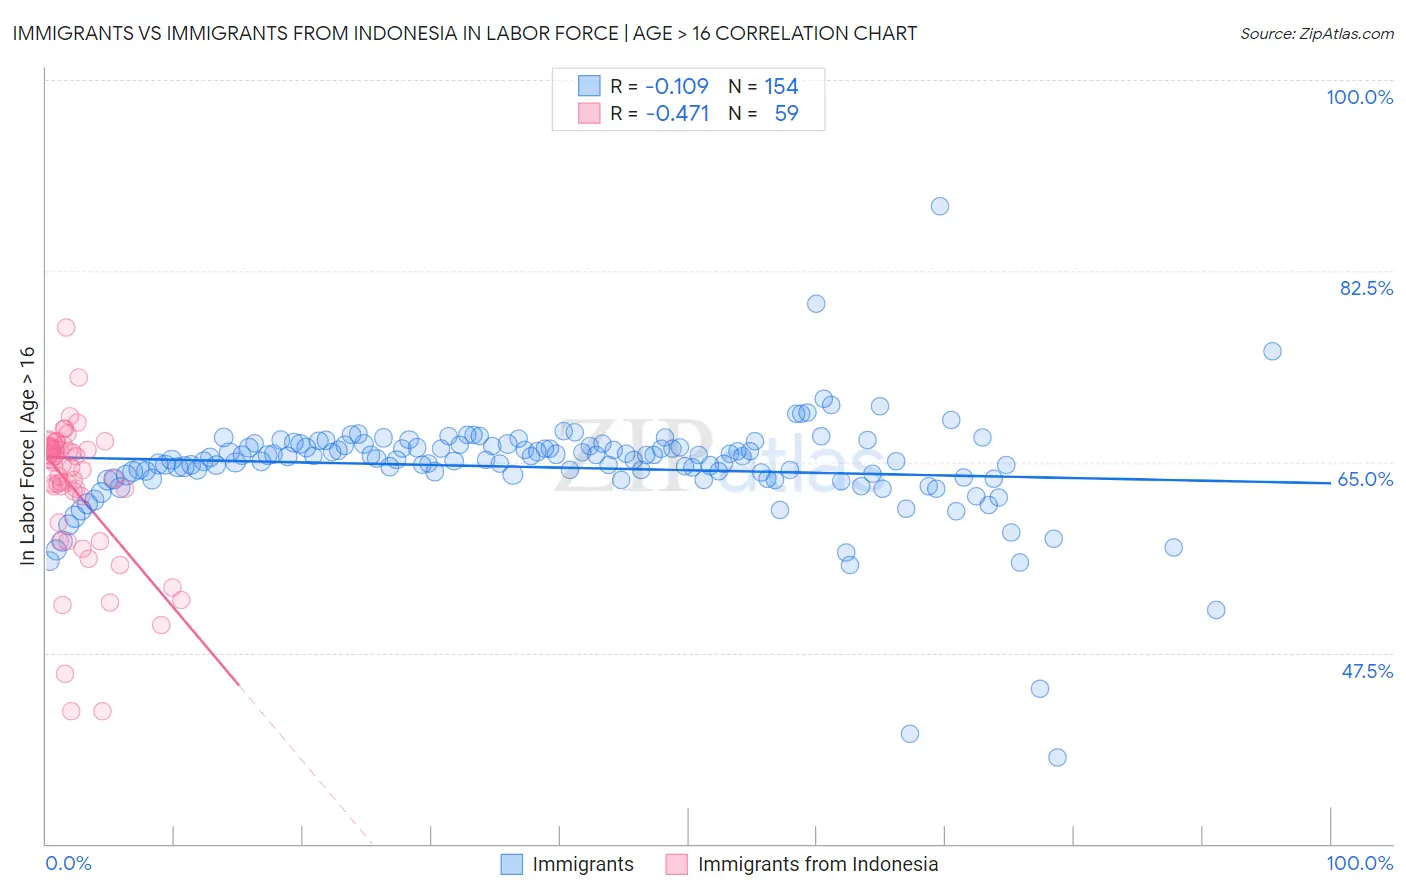
Immigrants vs Immigrants from Indonesia In Labor Force | Age > 16 Correlation Chart
The statistical analysis conducted on geographies consisting of 577,773,674 people shows a poor negative correlation between the proportion of Immigrants and labor force participation rate among population ages 16 and over in the United States with a correlation coefficient (R) of -0.109 and weighted average of 65.4%. Similarly, the statistical analysis conducted on geographies consisting of 215,789,599 people shows a moderate negative correlation between the proportion of Immigrants from Indonesia and labor force participation rate among population ages 16 and over in the United States with a correlation coefficient (R) of -0.471 and weighted average of 65.7%, a difference of 0.53%.
In Labor Force | Age > 16 Correlation Summary
| Measurement | Immigrants | Immigrants from Indonesia |
| Minimum | 37.9% | 42.1% |
| Maximum | 88.4% | 77.3% |
| Range | 50.5% | 35.2% |
| Mean | 64.5% | 62.4% |
| Median | 65.2% | 64.5% |
| Interquartile 25% (IQ1) | 63.5% | 59.4% |
| Interquartile 75% (IQ3) | 66.5% | 66.2% |
| Interquartile Range (IQR) | 3.0% | 6.8% |
| Standard Deviation (Sample) | 5.1% | 6.8% |
| Standard Deviation (Population) | 5.1% | 6.7% |
Similar Demographics by In Labor Force | Age > 16
Demographics Similar to Immigrants by In Labor Force | Age > 16
In terms of in labor force | age > 16, the demographic groups most similar to Immigrants are Czech (65.4%, a difference of 0.010%), Yugoslavian (65.4%, a difference of 0.010%), Immigrants from China (65.4%, a difference of 0.020%), Immigrants from Eastern Europe (65.4%, a difference of 0.060%), and Immigrants from Albania (65.4%, a difference of 0.080%).
| Demographics | Rating | Rank | In Labor Force | Age > 16 |
| Latvians | 89.4 /100 | #143 | Excellent 65.5% |
| Immigrants | Romania | 88.6 /100 | #144 | Excellent 65.5% |
| Tlingit-Haida | 88.3 /100 | #145 | Excellent 65.5% |
| Cypriots | 88.2 /100 | #146 | Excellent 65.5% |
| Immigrants | Oceania | 87.5 /100 | #147 | Excellent 65.5% |
| Bhutanese | 86.3 /100 | #148 | Excellent 65.5% |
| Immigrants | Albania | 85.7 /100 | #149 | Excellent 65.4% |
| Immigrants | Immigrants | 81.9 /100 | #150 | Excellent 65.4% |
| Czechs | 81.5 /100 | #151 | Excellent 65.4% |
| Yugoslavians | 81.3 /100 | #152 | Excellent 65.4% |
| Immigrants | China | 80.5 /100 | #153 | Excellent 65.4% |
| Immigrants | Eastern Europe | 78.3 /100 | #154 | Good 65.4% |
| Immigrants | Armenia | 76.6 /100 | #155 | Good 65.3% |
| Immigrants | Ireland | 75.9 /100 | #156 | Good 65.3% |
| Immigrants | Russia | 75.7 /100 | #157 | Good 65.3% |
Demographics Similar to Immigrants from Indonesia by In Labor Force | Age > 16
In terms of in labor force | age > 16, the demographic groups most similar to Immigrants from Indonesia are Argentinean (65.7%, a difference of 0.010%), Immigrants from Iran (65.7%, a difference of 0.010%), Immigrants from Thailand (65.7%, a difference of 0.020%), Pakistani (65.8%, a difference of 0.030%), and Honduran (65.8%, a difference of 0.030%).
| Demographics | Rating | Rank | In Labor Force | Age > 16 |
| Immigrants | Spain | 98.0 /100 | #108 | Exceptional 65.8% |
| Immigrants | Japan | 98.0 /100 | #109 | Exceptional 65.8% |
| Japanese | 97.7 /100 | #110 | Exceptional 65.8% |
| Immigrants | Honduras | 97.5 /100 | #111 | Exceptional 65.8% |
| Laotians | 97.4 /100 | #112 | Exceptional 65.8% |
| Pakistanis | 97.1 /100 | #113 | Exceptional 65.8% |
| Hondurans | 97.1 /100 | #114 | Exceptional 65.8% |
| Immigrants | Indonesia | 96.8 /100 | #115 | Exceptional 65.7% |
| Argentineans | 96.7 /100 | #116 | Exceptional 65.7% |
| Immigrants | Iran | 96.6 /100 | #117 | Exceptional 65.7% |
| Immigrants | Thailand | 96.6 /100 | #118 | Exceptional 65.7% |
| Immigrants | France | 96.4 /100 | #119 | Exceptional 65.7% |
| Immigrants | Hong Kong | 96.2 /100 | #120 | Exceptional 65.7% |
| New Zealanders | 96.0 /100 | #121 | Exceptional 65.7% |
| Immigrants | Ecuador | 95.9 /100 | #122 | Exceptional 65.7% |