Immigrants from Zaire vs Immigrants Median Male Earnings
COMPARE
Immigrants from Zaire
Immigrants
Median Male Earnings
Median Male Earnings Comparison
Immigrants from Zaire
Immigrants
$47,070
MEDIAN MALE EARNINGS
0.1/ 100
METRIC RATING
299th/ 347
METRIC RANK
$54,168
MEDIAN MALE EARNINGS
42.1/ 100
METRIC RATING
181st/ 347
METRIC RANK
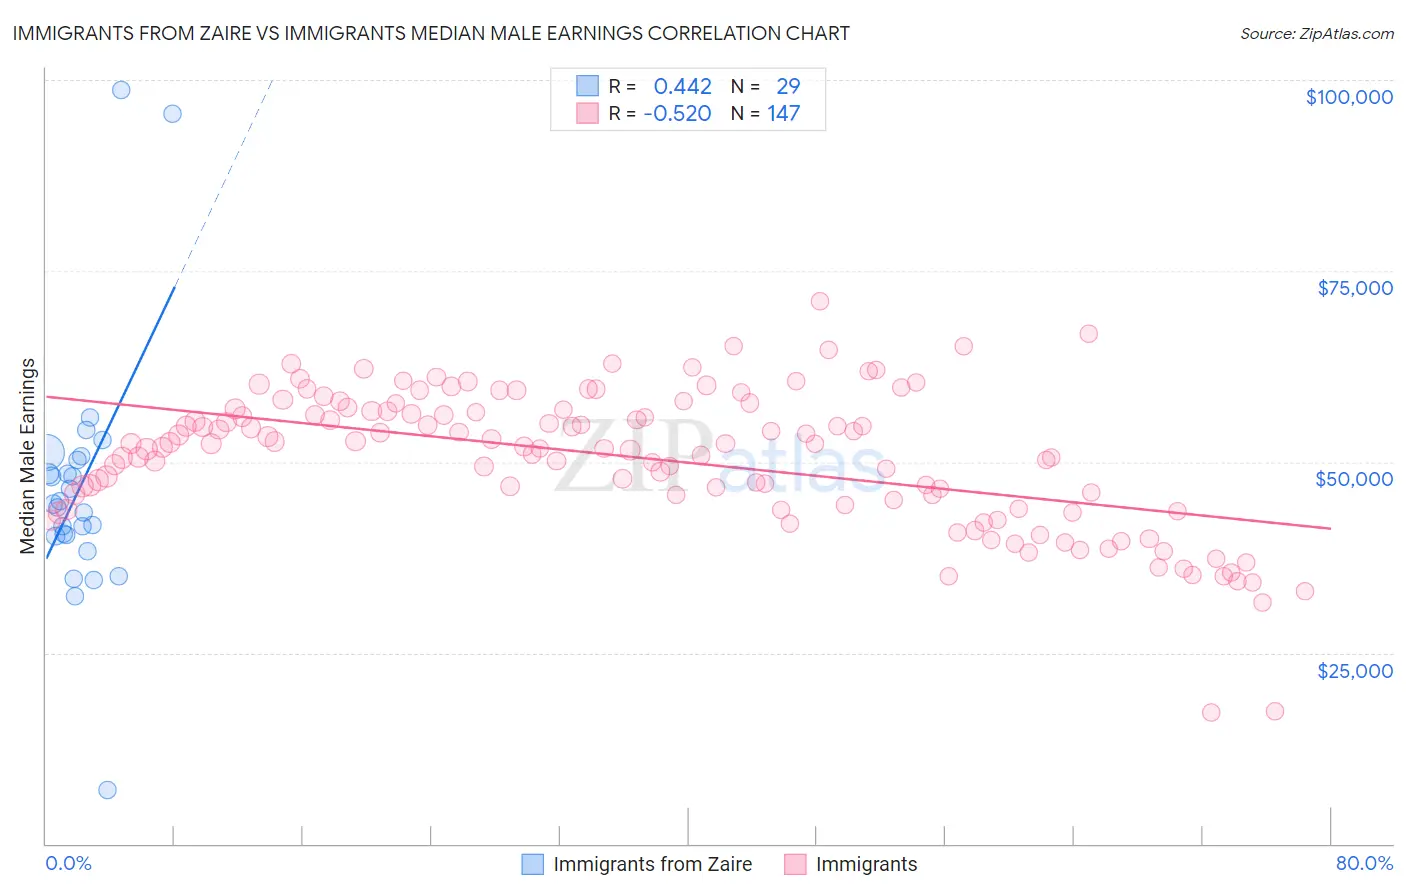
Immigrants from Zaire vs Immigrants Median Male Earnings Correlation Chart
The statistical analysis conducted on geographies consisting of 107,252,506 people shows a moderate positive correlation between the proportion of Immigrants from Zaire and median male earnings in the United States with a correlation coefficient (R) of 0.442 and weighted average of $47,070. Similarly, the statistical analysis conducted on geographies consisting of 575,766,345 people shows a substantial negative correlation between the proportion of Immigrants and median male earnings in the United States with a correlation coefficient (R) of -0.520 and weighted average of $54,168, a difference of 15.1%.
Median Male Earnings Correlation Summary
| Measurement | Immigrants from Zaire | Immigrants |
| Minimum | $7,065 | $17,250 |
| Maximum | $98,750 | $71,068 |
| Range | $91,685 | $53,818 |
| Mean | $46,699 | $50,484 |
| Median | $44,438 | $52,327 |
| Interquartile 25% (IQ1) | $40,386 | $44,402 |
| Interquartile 75% (IQ3) | $50,511 | $56,800 |
| Interquartile Range (IQR) | $10,125 | $12,398 |
| Standard Deviation (Sample) | $16,725 | $9,155 |
| Standard Deviation (Population) | $16,434 | $9,124 |
Similar Demographics by Median Male Earnings
Demographics Similar to Immigrants from Zaire by Median Male Earnings
In terms of median male earnings, the demographic groups most similar to Immigrants from Zaire are U.S. Virgin Islander ($47,066, a difference of 0.010%), Immigrants from Micronesia ($47,177, a difference of 0.23%), Dominican ($47,204, a difference of 0.28%), Immigrants from Latin America ($46,941, a difference of 0.28%), and Inupiat ($47,281, a difference of 0.45%).
| Demographics | Rating | Rank | Median Male Earnings |
| Immigrants | Dominica | 0.1 /100 | #292 | Tragic $47,651 |
| Indonesians | 0.1 /100 | #293 | Tragic $47,503 |
| Immigrants | Nicaragua | 0.1 /100 | #294 | Tragic $47,482 |
| Central American Indians | 0.1 /100 | #295 | Tragic $47,433 |
| Inupiat | 0.1 /100 | #296 | Tragic $47,281 |
| Dominicans | 0.1 /100 | #297 | Tragic $47,204 |
| Immigrants | Micronesia | 0.1 /100 | #298 | Tragic $47,177 |
| Immigrants | Zaire | 0.1 /100 | #299 | Tragic $47,070 |
| U.S. Virgin Islanders | 0.1 /100 | #300 | Tragic $47,066 |
| Immigrants | Latin America | 0.1 /100 | #301 | Tragic $46,941 |
| Seminole | 0.1 /100 | #302 | Tragic $46,783 |
| Yaqui | 0.1 /100 | #303 | Tragic $46,777 |
| Bangladeshis | 0.1 /100 | #304 | Tragic $46,744 |
| Guatemalans | 0.0 /100 | #305 | Tragic $46,736 |
| Dutch West Indians | 0.0 /100 | #306 | Tragic $46,656 |
Demographics Similar to Immigrants by Median Male Earnings
In terms of median male earnings, the demographic groups most similar to Immigrants are Iraqi ($54,182, a difference of 0.030%), Celtic ($54,242, a difference of 0.14%), Costa Rican ($54,279, a difference of 0.21%), Sierra Leonean ($54,279, a difference of 0.21%), and Yugoslavian ($53,967, a difference of 0.37%).
| Demographics | Rating | Rank | Median Male Earnings |
| South Americans | 50.0 /100 | #174 | Average $54,492 |
| Dutch | 48.0 /100 | #175 | Average $54,410 |
| Spaniards | 47.8 /100 | #176 | Average $54,401 |
| Costa Ricans | 44.8 /100 | #177 | Average $54,279 |
| Sierra Leoneans | 44.8 /100 | #178 | Average $54,279 |
| Celtics | 43.9 /100 | #179 | Average $54,242 |
| Iraqis | 42.5 /100 | #180 | Average $54,182 |
| Immigrants | Immigrants | 42.1 /100 | #181 | Average $54,168 |
| Yugoslavians | 37.4 /100 | #182 | Fair $53,967 |
| Immigrants | South America | 37.3 /100 | #183 | Fair $53,962 |
| Whites/Caucasians | 36.5 /100 | #184 | Fair $53,925 |
| Immigrants | Sierra Leone | 36.0 /100 | #185 | Fair $53,905 |
| Colombians | 34.4 /100 | #186 | Fair $53,832 |
| Immigrants | Eritrea | 31.8 /100 | #187 | Fair $53,715 |
| Immigrants | Eastern Africa | 31.8 /100 | #188 | Fair $53,713 |