Immigrants from Yemen vs Immigrants from Kuwait In Labor Force | Age > 16
COMPARE
Immigrants from Yemen
Immigrants from Kuwait
In Labor Force | Age > 16
In Labor Force | Age > 16 Comparison
Immigrants from Yemen
Immigrants from Kuwait
59.6%
IN LABOR FORCE | AGE > 16
0.0/ 100
METRIC RATING
338th/ 347
METRIC RANK
66.5%
IN LABOR FORCE | AGE > 16
100.0/ 100
METRIC RATING
51st/ 347
METRIC RANK
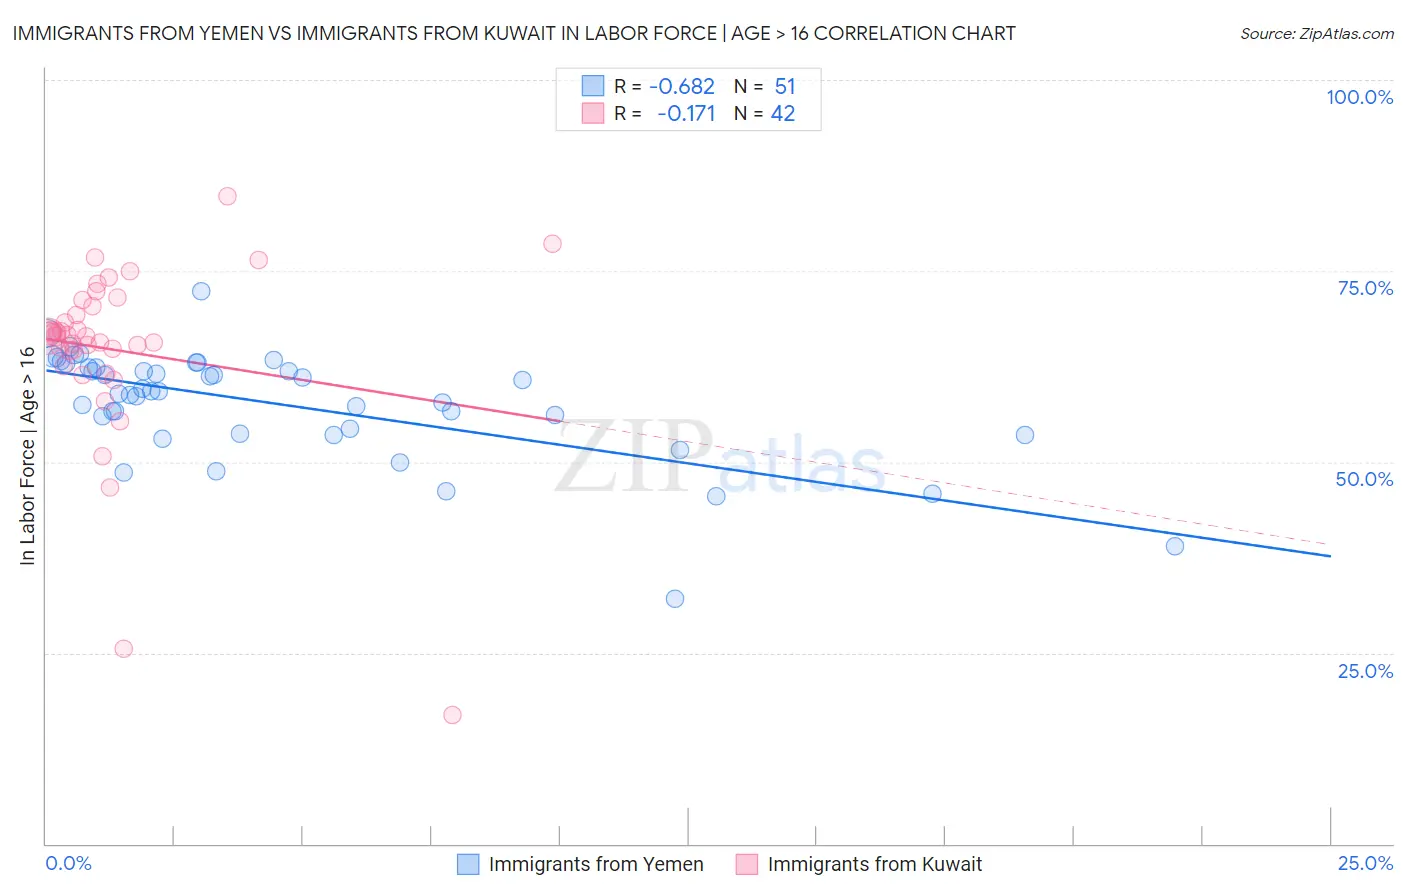
Immigrants from Yemen vs Immigrants from Kuwait In Labor Force | Age > 16 Correlation Chart
The statistical analysis conducted on geographies consisting of 82,433,611 people shows a significant negative correlation between the proportion of Immigrants from Yemen and labor force participation rate among population ages 16 and over in the United States with a correlation coefficient (R) of -0.682 and weighted average of 59.6%. Similarly, the statistical analysis conducted on geographies consisting of 136,916,630 people shows a poor negative correlation between the proportion of Immigrants from Kuwait and labor force participation rate among population ages 16 and over in the United States with a correlation coefficient (R) of -0.171 and weighted average of 66.5%, a difference of 11.5%.
In Labor Force | Age > 16 Correlation Summary
| Measurement | Immigrants from Yemen | Immigrants from Kuwait |
| Minimum | 32.0% | 16.8% |
| Maximum | 72.4% | 84.7% |
| Range | 40.4% | 67.9% |
| Mean | 57.6% | 64.6% |
| Median | 59.3% | 66.5% |
| Interquartile 25% (IQ1) | 53.7% | 64.5% |
| Interquartile 75% (IQ3) | 62.3% | 70.4% |
| Interquartile Range (IQR) | 8.6% | 5.9% |
| Standard Deviation (Sample) | 7.2% | 12.0% |
| Standard Deviation (Population) | 7.2% | 11.9% |
Similar Demographics by In Labor Force | Age > 16
Demographics Similar to Immigrants from Yemen by In Labor Force | Age > 16
In terms of in labor force | age > 16, the demographic groups most similar to Immigrants from Yemen are Houma (59.5%, a difference of 0.25%), Colville (59.8%, a difference of 0.27%), Pueblo (59.3%, a difference of 0.64%), Menominee (60.6%, a difference of 1.5%), and Native/Alaskan (60.6%, a difference of 1.6%).
| Demographics | Rating | Rank | In Labor Force | Age > 16 |
| Ute | 0.0 /100 | #331 | Tragic 60.9% |
| Crow | 0.0 /100 | #332 | Tragic 60.8% |
| Paiute | 0.0 /100 | #333 | Tragic 60.7% |
| Apache | 0.0 /100 | #334 | Tragic 60.7% |
| Natives/Alaskans | 0.0 /100 | #335 | Tragic 60.6% |
| Menominee | 0.0 /100 | #336 | Tragic 60.6% |
| Colville | 0.0 /100 | #337 | Tragic 59.8% |
| Immigrants | Yemen | 0.0 /100 | #338 | Tragic 59.6% |
| Houma | 0.0 /100 | #339 | Tragic 59.5% |
| Pueblo | 0.0 /100 | #340 | Tragic 59.3% |
| Hopi | 0.0 /100 | #341 | Tragic 58.4% |
| Puerto Ricans | 0.0 /100 | #342 | Tragic 58.1% |
| Yuman | 0.0 /100 | #343 | Tragic 57.8% |
| Pima | 0.0 /100 | #344 | Tragic 57.4% |
| Tohono O'odham | 0.0 /100 | #345 | Tragic 57.2% |
Demographics Similar to Immigrants from Kuwait by In Labor Force | Age > 16
In terms of in labor force | age > 16, the demographic groups most similar to Immigrants from Kuwait are Paraguayan (66.5%, a difference of 0.030%), Immigrants from Sri Lanka (66.5%, a difference of 0.050%), Cape Verdean (66.6%, a difference of 0.070%), Immigrants from Bosnia and Herzegovina (66.5%, a difference of 0.080%), and Immigrants from Northern Africa (66.6%, a difference of 0.12%).
| Demographics | Rating | Rank | In Labor Force | Age > 16 |
| Immigrants | Pakistan | 100.0 /100 | #44 | Exceptional 66.7% |
| Immigrants | Brazil | 100.0 /100 | #45 | Exceptional 66.7% |
| Brazilians | 100.0 /100 | #46 | Exceptional 66.6% |
| Immigrants | Bulgaria | 100.0 /100 | #47 | Exceptional 66.6% |
| Nigerians | 100.0 /100 | #48 | Exceptional 66.6% |
| Immigrants | Northern Africa | 100.0 /100 | #49 | Exceptional 66.6% |
| Cape Verdeans | 100.0 /100 | #50 | Exceptional 66.6% |
| Immigrants | Kuwait | 100.0 /100 | #51 | Exceptional 66.5% |
| Paraguayans | 99.9 /100 | #52 | Exceptional 66.5% |
| Immigrants | Sri Lanka | 99.9 /100 | #53 | Exceptional 66.5% |
| Immigrants | Bosnia and Herzegovina | 99.9 /100 | #54 | Exceptional 66.5% |
| Immigrants | Venezuela | 99.9 /100 | #55 | Exceptional 66.4% |
| Immigrants | Senegal | 99.9 /100 | #56 | Exceptional 66.4% |
| Bulgarians | 99.9 /100 | #57 | Exceptional 66.4% |
| Immigrants | Saudi Arabia | 99.9 /100 | #58 | Exceptional 66.3% |