Immigrants from Yemen vs Okinawan Unemployment Among Seniors over 65 years
COMPARE
Immigrants from Yemen
Okinawan
Unemployment Among Seniors over 65 years
Unemployment Among Seniors over 65 years Comparison
Immigrants from Yemen
Okinawans
8.2%
UNEMPLOYMENT AMONG SENIORS OVER 65 YEARS
0.0/ 100
METRIC RATING
345th/ 347
METRIC RANK
5.0%
UNEMPLOYMENT AMONG SENIORS OVER 65 YEARS
94.7/ 100
METRIC RATING
105th/ 347
METRIC RANK
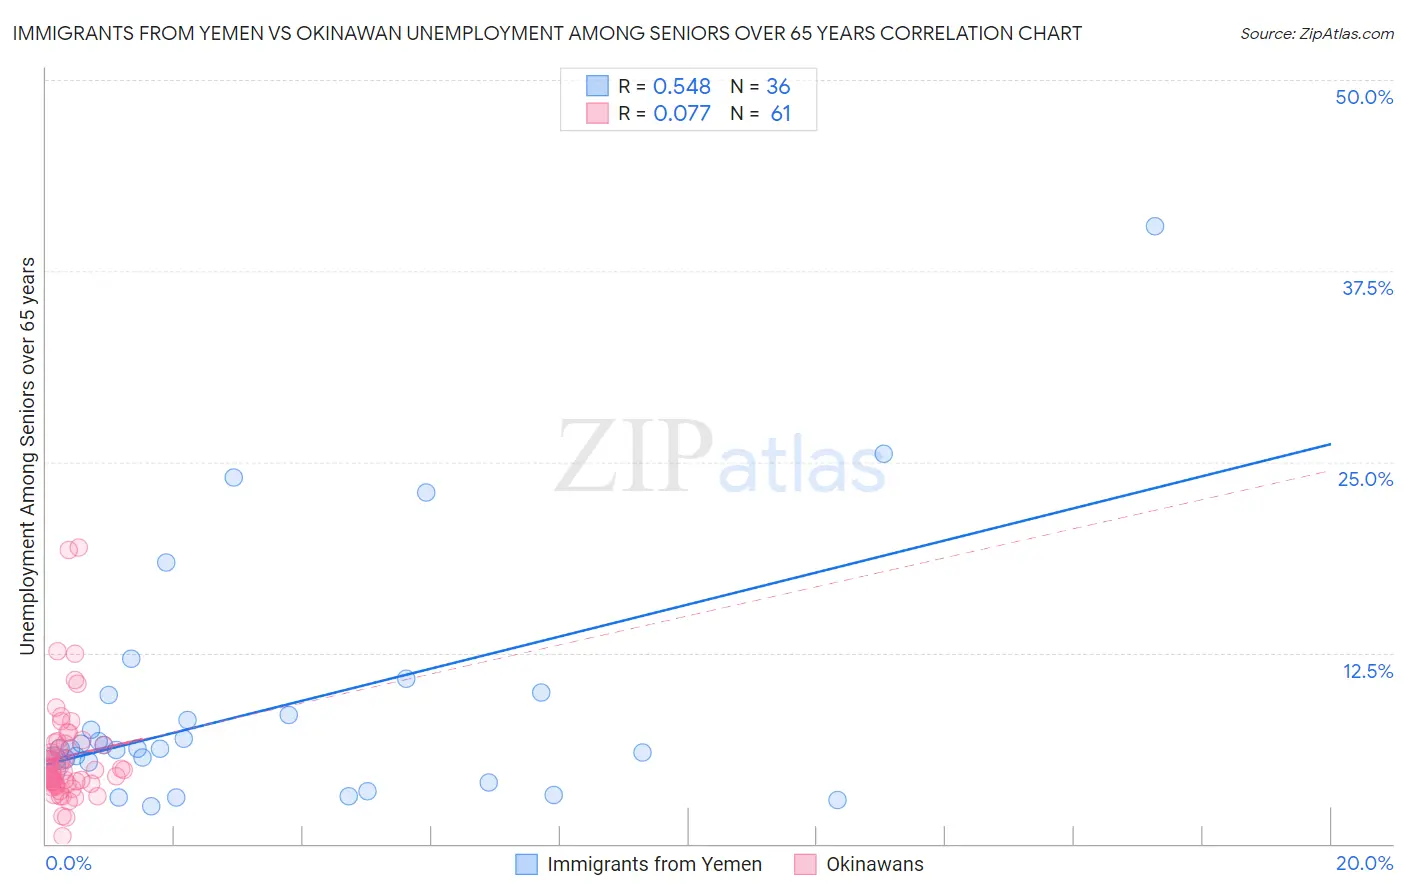
Immigrants from Yemen vs Okinawan Unemployment Among Seniors over 65 years Correlation Chart
The statistical analysis conducted on geographies consisting of 80,179,365 people shows a substantial positive correlation between the proportion of Immigrants from Yemen and unemployment rate amomg seniors over the age of 65 in the United States with a correlation coefficient (R) of 0.548 and weighted average of 8.2%. Similarly, the statistical analysis conducted on geographies consisting of 72,306,358 people shows a slight positive correlation between the proportion of Okinawans and unemployment rate amomg seniors over the age of 65 in the United States with a correlation coefficient (R) of 0.077 and weighted average of 5.0%, a difference of 63.0%.
Unemployment Among Seniors over 65 years Correlation Summary
| Measurement | Immigrants from Yemen | Okinawan |
| Minimum | 2.4% | 0.50% |
| Maximum | 40.4% | 19.4% |
| Range | 38.0% | 18.9% |
| Mean | 8.9% | 5.7% |
| Median | 6.2% | 4.8% |
| Interquartile 25% (IQ1) | 5.1% | 3.9% |
| Interquartile 75% (IQ3) | 9.1% | 6.6% |
| Interquartile Range (IQR) | 3.9% | 2.7% |
| Standard Deviation (Sample) | 7.9% | 3.4% |
| Standard Deviation (Population) | 7.8% | 3.4% |
Similar Demographics by Unemployment Among Seniors over 65 years
Demographics Similar to Immigrants from Yemen by Unemployment Among Seniors over 65 years
In terms of unemployment among seniors over 65 years, the demographic groups most similar to Immigrants from Yemen are Yup'ik (9.1%, a difference of 11.4%), Alaskan Athabascan (7.0%, a difference of 16.4%), Tlingit-Haida (6.8%, a difference of 20.7%), Navajo (6.7%, a difference of 22.3%), and Yakama (6.7%, a difference of 22.9%).
| Demographics | Rating | Rank | Unemployment Among Seniors over 65 years |
| Immigrants | Dominican Republic | 0.0 /100 | #333 | Tragic 6.0% |
| Tohono O'odham | 0.0 /100 | #334 | Tragic 6.1% |
| Immigrants | Armenia | 0.0 /100 | #335 | Tragic 6.2% |
| Pima | 0.0 /100 | #336 | Tragic 6.3% |
| Alaska Natives | 0.0 /100 | #337 | Tragic 6.3% |
| Immigrants | Azores | 0.0 /100 | #338 | Tragic 6.3% |
| Paiute | 0.0 /100 | #339 | Tragic 6.3% |
| Ute | 0.0 /100 | #340 | Tragic 6.3% |
| Yakama | 0.0 /100 | #341 | Tragic 6.7% |
| Navajo | 0.0 /100 | #342 | Tragic 6.7% |
| Tlingit-Haida | 0.0 /100 | #343 | Tragic 6.8% |
| Alaskan Athabascans | 0.0 /100 | #344 | Tragic 7.0% |
| Immigrants | Yemen | 0.0 /100 | #345 | Tragic 8.2% |
| Yup'ik | 0.0 /100 | #346 | Tragic 9.1% |
| Crow | 0.0 /100 | #347 | Tragic 16.9% |
Demographics Similar to Okinawans by Unemployment Among Seniors over 65 years
In terms of unemployment among seniors over 65 years, the demographic groups most similar to Okinawans are Immigrants from Scotland (5.0%, a difference of 0.050%), Immigrants from Turkey (5.0%, a difference of 0.060%), Immigrants from Lithuania (5.0%, a difference of 0.070%), Immigrants from Thailand (5.0%, a difference of 0.12%), and Yugoslavian (5.0%, a difference of 0.13%).
| Demographics | Rating | Rank | Unemployment Among Seniors over 65 years |
| Czechoslovakians | 96.7 /100 | #98 | Exceptional 5.0% |
| South Africans | 96.5 /100 | #99 | Exceptional 5.0% |
| Romanians | 95.5 /100 | #100 | Exceptional 5.0% |
| Yugoslavians | 95.4 /100 | #101 | Exceptional 5.0% |
| Immigrants | Thailand | 95.4 /100 | #102 | Exceptional 5.0% |
| Immigrants | Lithuania | 95.1 /100 | #103 | Exceptional 5.0% |
| Immigrants | Scotland | 95.0 /100 | #104 | Exceptional 5.0% |
| Okinawans | 94.7 /100 | #105 | Exceptional 5.0% |
| Immigrants | Turkey | 94.3 /100 | #106 | Exceptional 5.0% |
| Immigrants | Germany | 93.2 /100 | #107 | Exceptional 5.0% |
| Immigrants | Vietnam | 92.9 /100 | #108 | Exceptional 5.0% |
| Immigrants | Malaysia | 92.7 /100 | #109 | Exceptional 5.0% |
| Immigrants | Saudi Arabia | 92.7 /100 | #110 | Exceptional 5.0% |
| Finns | 92.2 /100 | #111 | Exceptional 5.0% |
| Eastern Europeans | 92.0 /100 | #112 | Exceptional 5.0% |