Immigrants from Yemen vs Immigrants from Western Europe In Labor Force | Age 45-54
COMPARE
Immigrants from Yemen
Immigrants from Western Europe
In Labor Force | Age 45-54
In Labor Force | Age 45-54 Comparison
Immigrants from Yemen
Immigrants from Western Europe
74.4%
IN LABOR FORCE | AGE 45-54
0.0/ 100
METRIC RATING
344th/ 347
METRIC RANK
82.4%
IN LABOR FORCE | AGE 45-54
10.9/ 100
METRIC RATING
204th/ 347
METRIC RANK
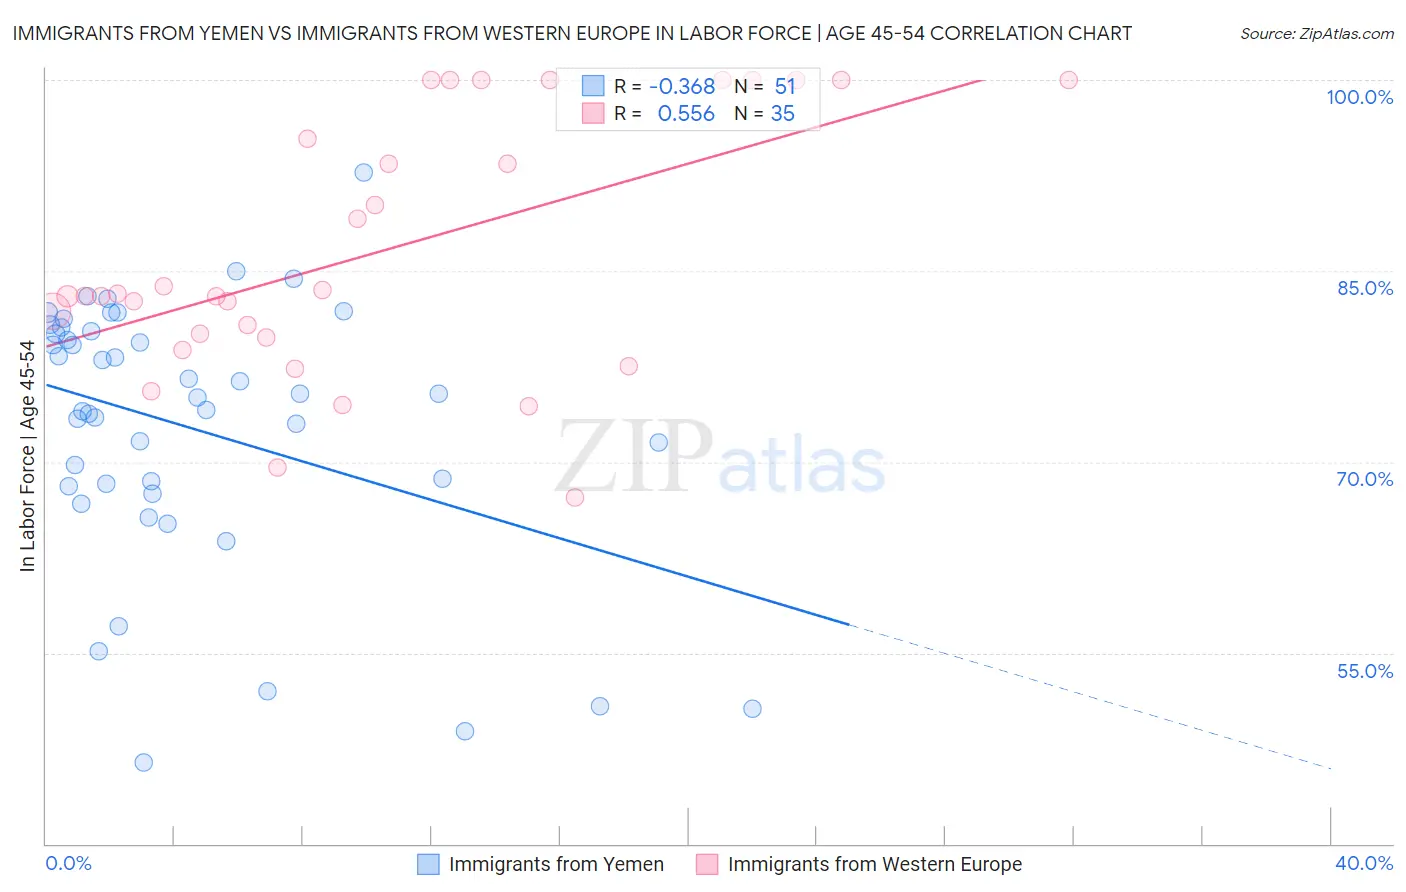
Immigrants from Yemen vs Immigrants from Western Europe In Labor Force | Age 45-54 Correlation Chart
The statistical analysis conducted on geographies consisting of 82,433,611 people shows a mild negative correlation between the proportion of Immigrants from Yemen and labor force participation rate among population between the ages 45 and 54 in the United States with a correlation coefficient (R) of -0.368 and weighted average of 74.4%. Similarly, the statistical analysis conducted on geographies consisting of 493,798,681 people shows a substantial positive correlation between the proportion of Immigrants from Western Europe and labor force participation rate among population between the ages 45 and 54 in the United States with a correlation coefficient (R) of 0.556 and weighted average of 82.4%, a difference of 10.7%.
In Labor Force | Age 45-54 Correlation Summary
| Measurement | Immigrants from Yemen | Immigrants from Western Europe |
| Minimum | 46.4% | 67.2% |
| Maximum | 92.7% | 100.0% |
| Range | 46.3% | 32.8% |
| Mean | 72.7% | 86.5% |
| Median | 75.1% | 83.1% |
| Interquartile 25% (IQ1) | 68.1% | 79.8% |
| Interquartile 75% (IQ3) | 80.3% | 100.0% |
| Interquartile Range (IQR) | 12.2% | 20.2% |
| Standard Deviation (Sample) | 10.4% | 10.0% |
| Standard Deviation (Population) | 10.3% | 9.8% |
Similar Demographics by In Labor Force | Age 45-54
Demographics Similar to Immigrants from Yemen by In Labor Force | Age 45-54
In terms of in labor force | age 45-54, the demographic groups most similar to Immigrants from Yemen are Houma (74.1%, a difference of 0.48%), Hopi (75.0%, a difference of 0.78%), Tohono O'odham (75.1%, a difference of 0.96%), Pueblo (75.5%, a difference of 1.5%), and Lumbee (75.6%, a difference of 1.6%).
| Demographics | Rating | Rank | In Labor Force | Age 45-54 |
| Natives/Alaskans | 0.0 /100 | #333 | Tragic 77.1% |
| Apache | 0.0 /100 | #334 | Tragic 77.1% |
| Arapaho | 0.0 /100 | #335 | Tragic 77.1% |
| Paiute | 0.0 /100 | #336 | Tragic 76.7% |
| Ute | 0.0 /100 | #337 | Tragic 76.6% |
| Yuman | 0.0 /100 | #338 | Tragic 76.3% |
| Puerto Ricans | 0.0 /100 | #339 | Tragic 75.9% |
| Lumbee | 0.0 /100 | #340 | Tragic 75.6% |
| Pueblo | 0.0 /100 | #341 | Tragic 75.5% |
| Tohono O'odham | 0.0 /100 | #342 | Tragic 75.1% |
| Hopi | 0.0 /100 | #343 | Tragic 75.0% |
| Immigrants | Yemen | 0.0 /100 | #344 | Tragic 74.4% |
| Houma | 0.0 /100 | #345 | Tragic 74.1% |
| Pima | 0.0 /100 | #346 | Tragic 72.8% |
| Navajo | 0.0 /100 | #347 | Tragic 72.8% |
Demographics Similar to Immigrants from Western Europe by In Labor Force | Age 45-54
In terms of in labor force | age 45-54, the demographic groups most similar to Immigrants from Western Europe are Arab (82.4%, a difference of 0.010%), Senegalese (82.4%, a difference of 0.030%), Welsh (82.3%, a difference of 0.040%), Immigrants from Cabo Verde (82.3%, a difference of 0.060%), and Native Hawaiian (82.3%, a difference of 0.060%).
| Demographics | Rating | Rank | In Labor Force | Age 45-54 |
| Lebanese | 18.2 /100 | #197 | Poor 82.5% |
| Immigrants | Denmark | 17.9 /100 | #198 | Poor 82.5% |
| Moroccans | 15.7 /100 | #199 | Poor 82.5% |
| French Canadians | 15.4 /100 | #200 | Poor 82.5% |
| Canadians | 15.1 /100 | #201 | Poor 82.4% |
| Immigrants | Western Asia | 14.9 /100 | #202 | Poor 82.4% |
| Arabs | 11.6 /100 | #203 | Poor 82.4% |
| Immigrants | Western Europe | 10.9 /100 | #204 | Poor 82.4% |
| Senegalese | 9.5 /100 | #205 | Tragic 82.4% |
| Welsh | 9.2 /100 | #206 | Tragic 82.3% |
| Immigrants | Cabo Verde | 8.6 /100 | #207 | Tragic 82.3% |
| Native Hawaiians | 8.5 /100 | #208 | Tragic 82.3% |
| Immigrants | Lebanon | 7.4 /100 | #209 | Tragic 82.3% |
| Immigrants | Bahamas | 7.1 /100 | #210 | Tragic 82.3% |
| Immigrants | Syria | 6.6 /100 | #211 | Tragic 82.3% |