Immigrants from Yemen vs Cajun In Labor Force | Age 45-54
COMPARE
Immigrants from Yemen
Cajun
In Labor Force | Age 45-54
In Labor Force | Age 45-54 Comparison
Immigrants from Yemen
Cajuns
74.4%
IN LABOR FORCE | AGE 45-54
0.0/ 100
METRIC RATING
344th/ 347
METRIC RANK
78.1%
IN LABOR FORCE | AGE 45-54
0.0/ 100
METRIC RATING
327th/ 347
METRIC RANK
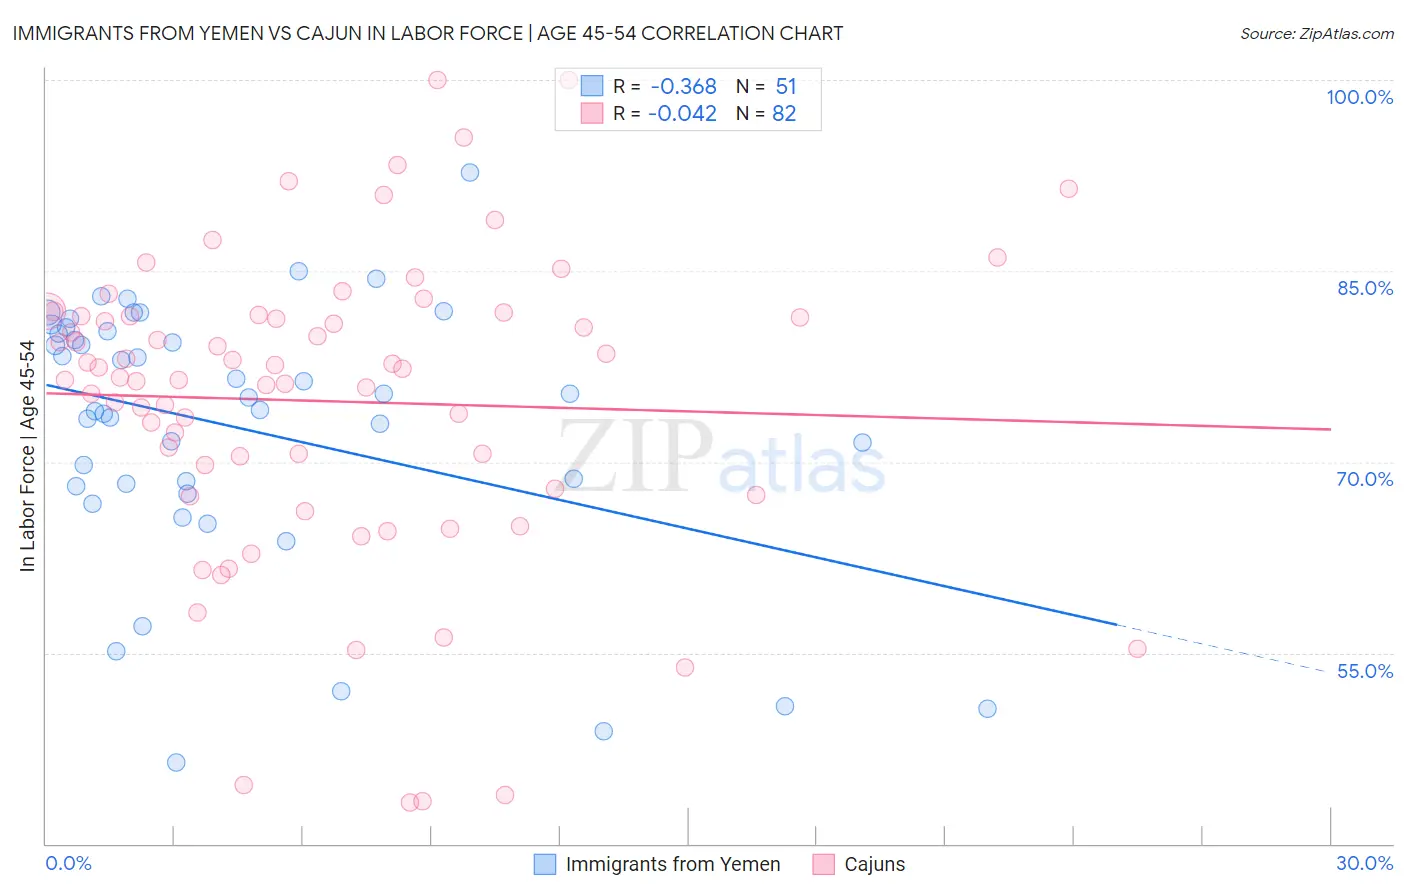
Immigrants from Yemen vs Cajun In Labor Force | Age 45-54 Correlation Chart
The statistical analysis conducted on geographies consisting of 82,433,611 people shows a mild negative correlation between the proportion of Immigrants from Yemen and labor force participation rate among population between the ages 45 and 54 in the United States with a correlation coefficient (R) of -0.368 and weighted average of 74.4%. Similarly, the statistical analysis conducted on geographies consisting of 149,692,418 people shows no correlation between the proportion of Cajuns and labor force participation rate among population between the ages 45 and 54 in the United States with a correlation coefficient (R) of -0.042 and weighted average of 78.1%, a difference of 5.0%.
In Labor Force | Age 45-54 Correlation Summary
| Measurement | Immigrants from Yemen | Cajun |
| Minimum | 46.4% | 43.2% |
| Maximum | 92.7% | 100.0% |
| Range | 46.3% | 56.8% |
| Mean | 72.7% | 74.8% |
| Median | 75.1% | 76.9% |
| Interquartile 25% (IQ1) | 68.1% | 67.9% |
| Interquartile 75% (IQ3) | 80.3% | 81.5% |
| Interquartile Range (IQR) | 12.2% | 13.6% |
| Standard Deviation (Sample) | 10.4% | 12.0% |
| Standard Deviation (Population) | 10.3% | 12.0% |
Demographics Similar to Immigrants from Yemen and Cajuns by In Labor Force | Age 45-54
In terms of in labor force | age 45-54, the demographic groups most similar to Immigrants from Yemen are Houma (74.1%, a difference of 0.48%), Hopi (75.0%, a difference of 0.78%), Tohono O'odham (75.1%, a difference of 0.96%), Pueblo (75.5%, a difference of 1.5%), and Lumbee (75.6%, a difference of 1.6%). Similarly, the demographic groups most similar to Cajuns are Seminole (78.1%, a difference of 0.0%), Choctaw (78.2%, a difference of 0.050%), Sioux (78.0%, a difference of 0.22%), Creek (77.7%, a difference of 0.51%), and Cheyenne (77.6%, a difference of 0.74%).
| Demographics | Rating | Rank | In Labor Force | Age 45-54 |
| Choctaw | 0.0 /100 | #325 | Tragic 78.2% |
| Seminole | 0.0 /100 | #326 | Tragic 78.1% |
| Cajuns | 0.0 /100 | #327 | Tragic 78.1% |
| Sioux | 0.0 /100 | #328 | Tragic 78.0% |
| Creek | 0.0 /100 | #329 | Tragic 77.7% |
| Cheyenne | 0.0 /100 | #330 | Tragic 77.6% |
| Tsimshian | 0.0 /100 | #331 | Tragic 77.4% |
| Menominee | 0.0 /100 | #332 | Tragic 77.4% |
| Natives/Alaskans | 0.0 /100 | #333 | Tragic 77.1% |
| Apache | 0.0 /100 | #334 | Tragic 77.1% |
| Arapaho | 0.0 /100 | #335 | Tragic 77.1% |
| Paiute | 0.0 /100 | #336 | Tragic 76.7% |
| Ute | 0.0 /100 | #337 | Tragic 76.6% |
| Yuman | 0.0 /100 | #338 | Tragic 76.3% |
| Puerto Ricans | 0.0 /100 | #339 | Tragic 75.9% |
| Lumbee | 0.0 /100 | #340 | Tragic 75.6% |
| Pueblo | 0.0 /100 | #341 | Tragic 75.5% |
| Tohono O'odham | 0.0 /100 | #342 | Tragic 75.1% |
| Hopi | 0.0 /100 | #343 | Tragic 75.0% |
| Immigrants | Yemen | 0.0 /100 | #344 | Tragic 74.4% |
| Houma | 0.0 /100 | #345 | Tragic 74.1% |