Immigrants from Western Europe vs Maltese In Labor Force | Age 20-24
COMPARE
Immigrants from Western Europe
Maltese
In Labor Force | Age 20-24
In Labor Force | Age 20-24 Comparison
Immigrants from Western Europe
Maltese
75.3%
IN LABOR FORCE | AGE 20-24
71.5/ 100
METRIC RATING
157th/ 347
METRIC RANK
76.3%
IN LABOR FORCE | AGE 20-24
98.9/ 100
METRIC RATING
92nd/ 347
METRIC RANK
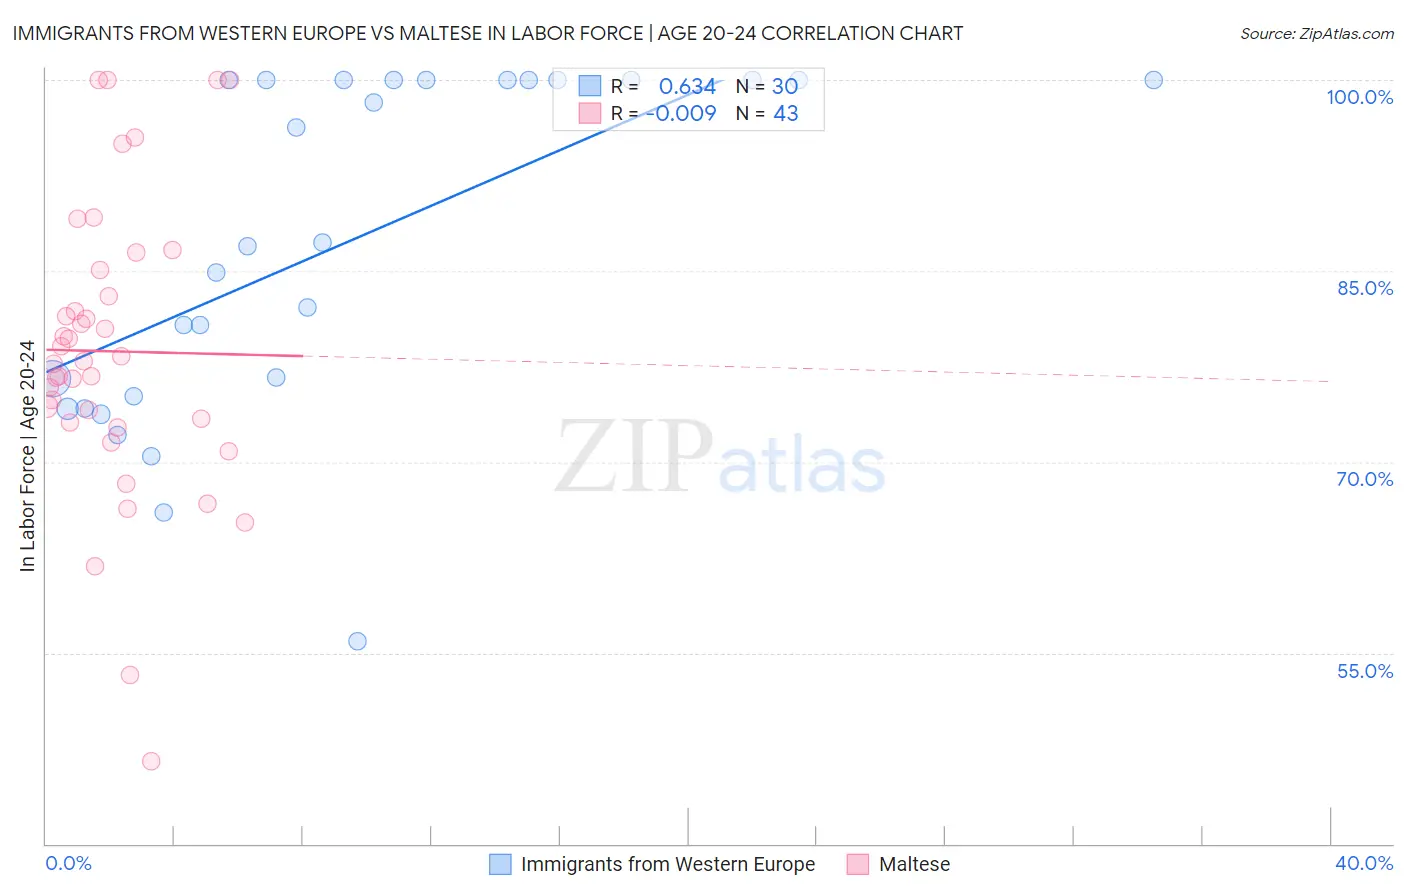
Immigrants from Western Europe vs Maltese In Labor Force | Age 20-24 Correlation Chart
The statistical analysis conducted on geographies consisting of 493,597,836 people shows a significant positive correlation between the proportion of Immigrants from Western Europe and labor force participation rate among population between the ages 20 and 24 in the United States with a correlation coefficient (R) of 0.634 and weighted average of 75.3%. Similarly, the statistical analysis conducted on geographies consisting of 126,433,922 people shows no correlation between the proportion of Maltese and labor force participation rate among population between the ages 20 and 24 in the United States with a correlation coefficient (R) of -0.009 and weighted average of 76.3%, a difference of 1.3%.
In Labor Force | Age 20-24 Correlation Summary
| Measurement | Immigrants from Western Europe | Maltese |
| Minimum | 55.9% | 46.5% |
| Maximum | 100.0% | 100.0% |
| Range | 44.1% | 53.5% |
| Mean | 87.1% | 78.7% |
| Median | 87.1% | 77.9% |
| Interquartile 25% (IQ1) | 75.1% | 73.1% |
| Interquartile 75% (IQ3) | 100.0% | 85.1% |
| Interquartile Range (IQR) | 24.9% | 12.0% |
| Standard Deviation (Sample) | 13.3% | 11.6% |
| Standard Deviation (Population) | 13.1% | 11.5% |
Similar Demographics by In Labor Force | Age 20-24
Demographics Similar to Immigrants from Western Europe by In Labor Force | Age 20-24
In terms of in labor force | age 20-24, the demographic groups most similar to Immigrants from Western Europe are Immigrants from El Salvador (75.3%, a difference of 0.0%), Guatemalan (75.3%, a difference of 0.010%), Osage (75.3%, a difference of 0.010%), Immigrants from Guatemala (75.3%, a difference of 0.010%), and Immigrants from Bolivia (75.3%, a difference of 0.010%).
| Demographics | Rating | Rank | In Labor Force | Age 20-24 |
| Salvadorans | 74.8 /100 | #150 | Good 75.3% |
| Paiute | 74.1 /100 | #151 | Good 75.3% |
| Lebanese | 73.5 /100 | #152 | Good 75.3% |
| Guatemalans | 72.3 /100 | #153 | Good 75.3% |
| Osage | 72.3 /100 | #154 | Good 75.3% |
| Immigrants | Guatemala | 71.9 /100 | #155 | Good 75.3% |
| Immigrants | El Salvador | 71.7 /100 | #156 | Good 75.3% |
| Immigrants | Western Europe | 71.5 /100 | #157 | Good 75.3% |
| Immigrants | Bolivia | 71.0 /100 | #158 | Good 75.3% |
| South American Indians | 69.0 /100 | #159 | Good 75.3% |
| Japanese | 68.7 /100 | #160 | Good 75.3% |
| New Zealanders | 65.4 /100 | #161 | Good 75.2% |
| Immigrants | Romania | 64.6 /100 | #162 | Good 75.2% |
| Costa Ricans | 64.2 /100 | #163 | Good 75.2% |
| Bolivians | 64.0 /100 | #164 | Good 75.2% |
Demographics Similar to Maltese by In Labor Force | Age 20-24
In terms of in labor force | age 20-24, the demographic groups most similar to Maltese are Hungarian (76.3%, a difference of 0.020%), Sierra Leonean (76.3%, a difference of 0.030%), Immigrants from Burma/Myanmar (76.3%, a difference of 0.050%), Spanish (76.4%, a difference of 0.10%), and Bulgarian (76.4%, a difference of 0.10%).
| Demographics | Rating | Rank | In Labor Force | Age 20-24 |
| Portuguese | 99.3 /100 | #85 | Exceptional 76.4% |
| Immigrants | Iraq | 99.3 /100 | #86 | Exceptional 76.4% |
| Immigrants | Thailand | 99.3 /100 | #87 | Exceptional 76.4% |
| Spanish | 99.2 /100 | #88 | Exceptional 76.4% |
| Bulgarians | 99.2 /100 | #89 | Exceptional 76.4% |
| Immigrants | Burma/Myanmar | 99.1 /100 | #90 | Exceptional 76.3% |
| Sierra Leoneans | 99.0 /100 | #91 | Exceptional 76.3% |
| Maltese | 98.9 /100 | #92 | Exceptional 76.3% |
| Hungarians | 98.9 /100 | #93 | Exceptional 76.3% |
| Potawatomi | 98.5 /100 | #94 | Exceptional 76.2% |
| Immigrants | Germany | 98.5 /100 | #95 | Exceptional 76.2% |
| Immigrants | Nonimmigrants | 98.5 /100 | #96 | Exceptional 76.2% |
| Immigrants | Lithuania | 98.0 /100 | #97 | Exceptional 76.1% |
| Immigrants | Oceania | 98.0 /100 | #98 | Exceptional 76.1% |
| Americans | 97.8 /100 | #99 | Exceptional 76.1% |