Iraqi vs Maltese In Labor Force | Age 20-24
COMPARE
Iraqi
Maltese
In Labor Force | Age 20-24
In Labor Force | Age 20-24 Comparison
Iraqis
Maltese
76.0%
IN LABOR FORCE | AGE 20-24
96.6/ 100
METRIC RATING
108th/ 347
METRIC RANK
76.3%
IN LABOR FORCE | AGE 20-24
98.9/ 100
METRIC RATING
92nd/ 347
METRIC RANK
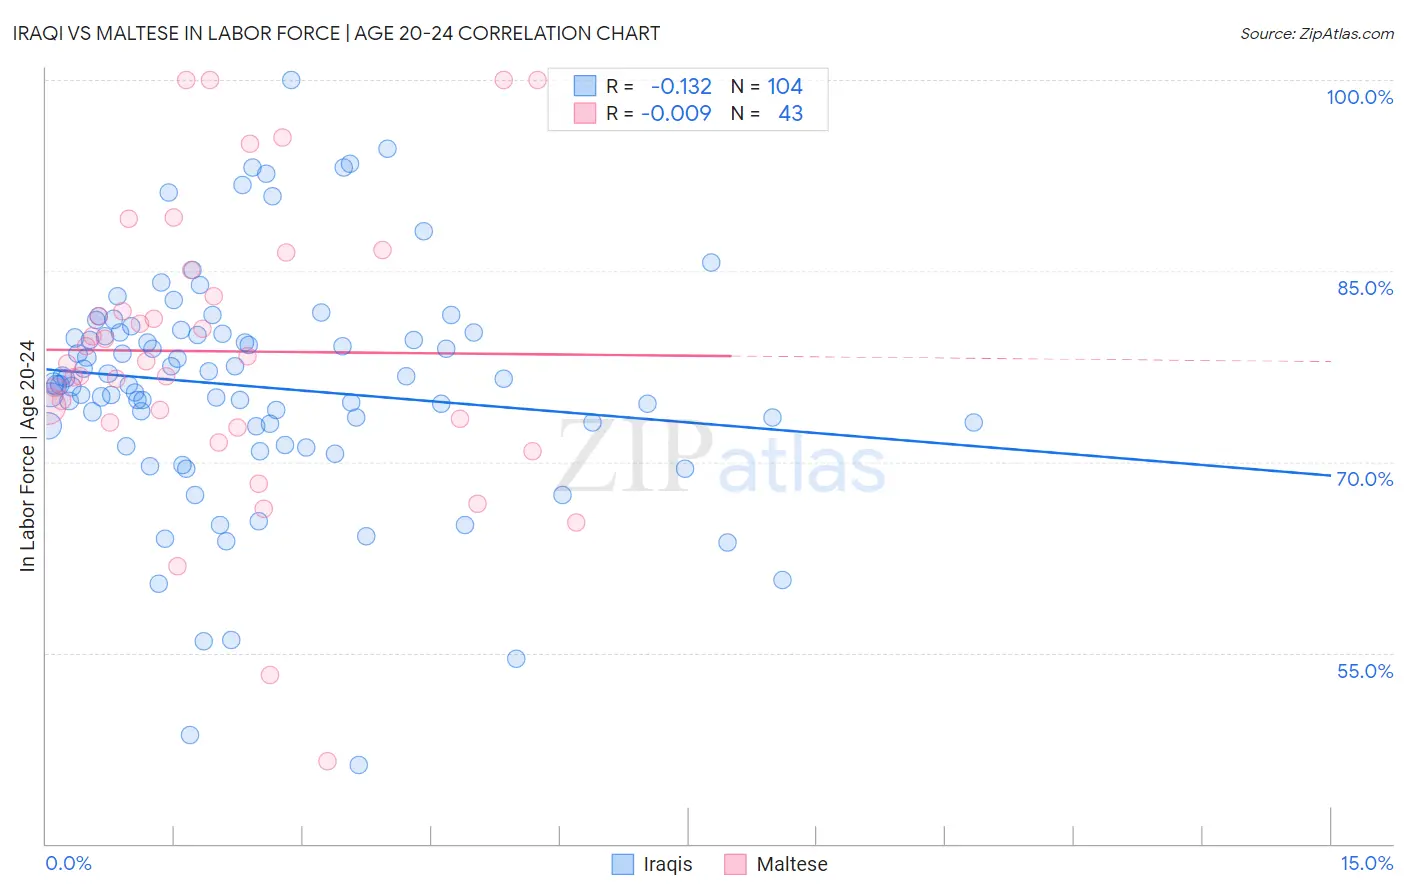
Iraqi vs Maltese In Labor Force | Age 20-24 Correlation Chart
The statistical analysis conducted on geographies consisting of 170,641,378 people shows a poor negative correlation between the proportion of Iraqis and labor force participation rate among population between the ages 20 and 24 in the United States with a correlation coefficient (R) of -0.132 and weighted average of 76.0%. Similarly, the statistical analysis conducted on geographies consisting of 126,433,922 people shows no correlation between the proportion of Maltese and labor force participation rate among population between the ages 20 and 24 in the United States with a correlation coefficient (R) of -0.009 and weighted average of 76.3%, a difference of 0.42%.
In Labor Force | Age 20-24 Correlation Summary
| Measurement | Iraqi | Maltese |
| Minimum | 46.2% | 46.5% |
| Maximum | 100.0% | 100.0% |
| Range | 53.8% | 53.5% |
| Mean | 75.9% | 78.7% |
| Median | 76.1% | 77.9% |
| Interquartile 25% (IQ1) | 72.8% | 73.1% |
| Interquartile 75% (IQ3) | 80.1% | 85.1% |
| Interquartile Range (IQR) | 7.3% | 12.0% |
| Standard Deviation (Sample) | 9.1% | 11.6% |
| Standard Deviation (Population) | 9.1% | 11.5% |
Demographics Similar to Iraqis and Maltese by In Labor Force | Age 20-24
In terms of in labor force | age 20-24, the demographic groups most similar to Iraqis are Greek (76.0%, a difference of 0.030%), Immigrants from Uganda (76.0%, a difference of 0.060%), Macedonian (76.0%, a difference of 0.070%), Immigrants from Nepal (76.0%, a difference of 0.070%), and Cherokee (75.9%, a difference of 0.080%). Similarly, the demographic groups most similar to Maltese are Hungarian (76.3%, a difference of 0.020%), Sierra Leonean (76.3%, a difference of 0.030%), Immigrants from Burma/Myanmar (76.3%, a difference of 0.050%), Potawatomi (76.2%, a difference of 0.11%), and Immigrants from Germany (76.2%, a difference of 0.12%).
| Demographics | Rating | Rank | In Labor Force | Age 20-24 |
| Immigrants | Burma/Myanmar | 99.1 /100 | #90 | Exceptional 76.3% |
| Sierra Leoneans | 99.0 /100 | #91 | Exceptional 76.3% |
| Maltese | 98.9 /100 | #92 | Exceptional 76.3% |
| Hungarians | 98.9 /100 | #93 | Exceptional 76.3% |
| Potawatomi | 98.5 /100 | #94 | Exceptional 76.2% |
| Immigrants | Germany | 98.5 /100 | #95 | Exceptional 76.2% |
| Immigrants | Nonimmigrants | 98.5 /100 | #96 | Exceptional 76.2% |
| Immigrants | Lithuania | 98.0 /100 | #97 | Exceptional 76.1% |
| Immigrants | Oceania | 98.0 /100 | #98 | Exceptional 76.1% |
| Americans | 97.8 /100 | #99 | Exceptional 76.1% |
| Shoshone | 97.8 /100 | #100 | Exceptional 76.1% |
| Immigrants | Poland | 97.7 /100 | #101 | Exceptional 76.1% |
| Latvians | 97.6 /100 | #102 | Exceptional 76.1% |
| Immigrants | North Macedonia | 97.5 /100 | #103 | Exceptional 76.1% |
| Macedonians | 97.2 /100 | #104 | Exceptional 76.0% |
| Immigrants | Nepal | 97.2 /100 | #105 | Exceptional 76.0% |
| Immigrants | Uganda | 97.1 /100 | #106 | Exceptional 76.0% |
| Greeks | 96.9 /100 | #107 | Exceptional 76.0% |
| Iraqis | 96.6 /100 | #108 | Exceptional 76.0% |
| Cherokee | 95.8 /100 | #109 | Exceptional 75.9% |
| Immigrants | Morocco | 95.8 /100 | #110 | Exceptional 75.9% |