Immigrants from Western Asia vs Trinidadian and Tobagonian Unemployment Among Women with Children Ages 6 to 17 years
COMPARE
Immigrants from Western Asia
Trinidadian and Tobagonian
Unemployment Among Women with Children Ages 6 to 17 years
Unemployment Among Women with Children Ages 6 to 17 years Comparison
Immigrants from Western Asia
Trinidadians and Tobagonians
8.7%
UNEMPLOYMENT AMONG WOMEN WITH CHILDREN AGES 6 TO 17 YEARS
93.1/ 100
METRIC RATING
130th/ 347
METRIC RANK
9.1%
UNEMPLOYMENT AMONG WOMEN WITH CHILDREN AGES 6 TO 17 YEARS
18.2/ 100
METRIC RATING
200th/ 347
METRIC RANK
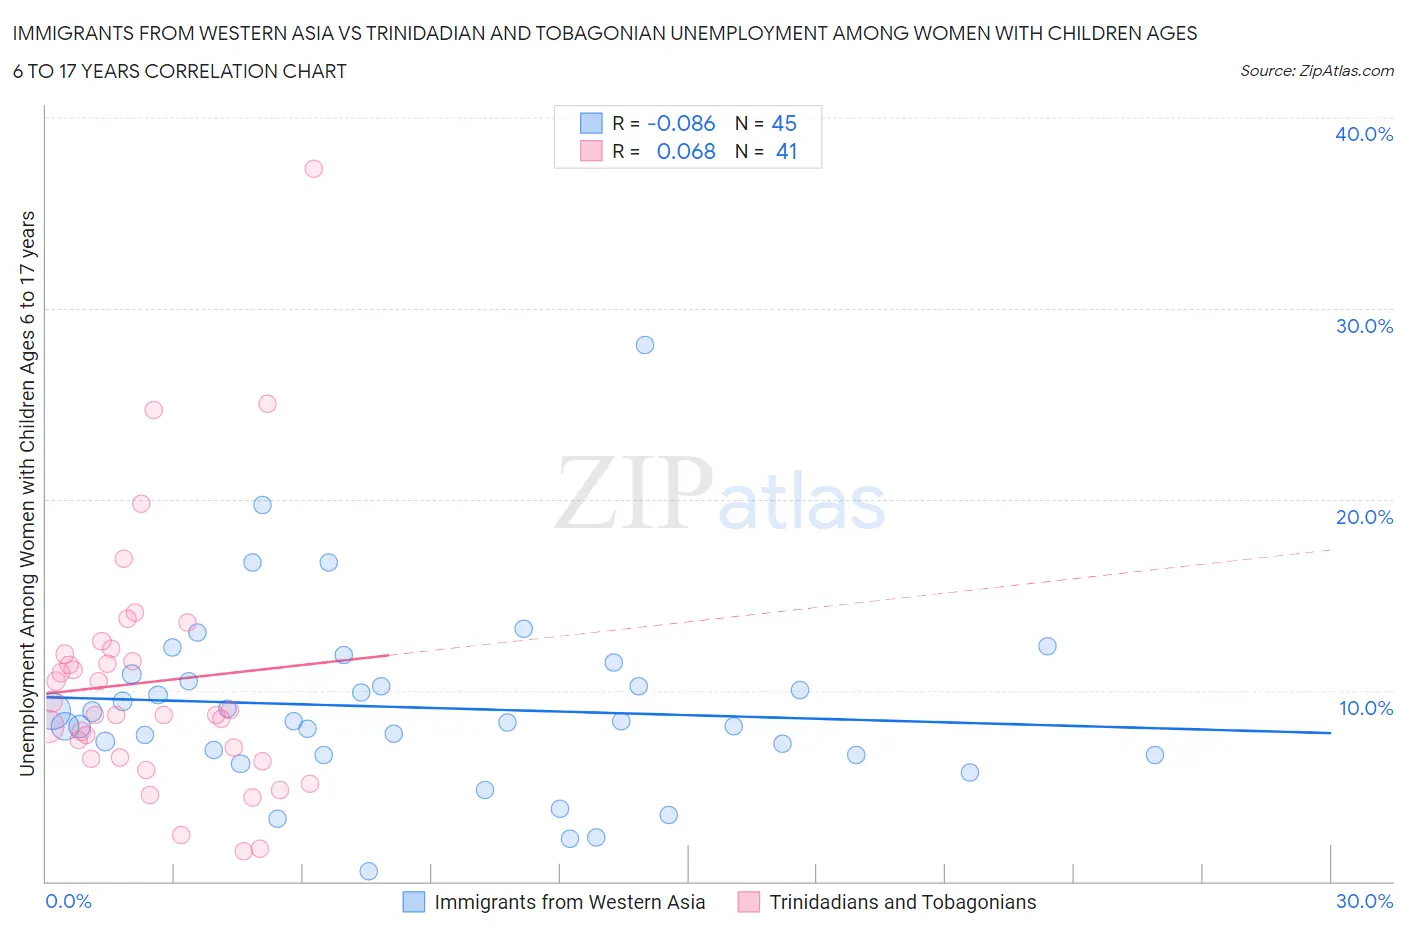
Immigrants from Western Asia vs Trinidadian and Tobagonian Unemployment Among Women with Children Ages 6 to 17 years Correlation Chart
The statistical analysis conducted on geographies consisting of 289,779,940 people shows a slight negative correlation between the proportion of Immigrants from Western Asia and unemployment rate among women with children between the ages 6 and 17 in the United States with a correlation coefficient (R) of -0.086 and weighted average of 8.7%. Similarly, the statistical analysis conducted on geographies consisting of 177,682,071 people shows a slight positive correlation between the proportion of Trinidadians and Tobagonians and unemployment rate among women with children between the ages 6 and 17 in the United States with a correlation coefficient (R) of 0.068 and weighted average of 9.1%, a difference of 4.7%.
Unemployment Among Women with Children Ages 6 to 17 years Correlation Summary
| Measurement | Immigrants from Western Asia | Trinidadian and Tobagonian |
| Minimum | 0.50% | 1.6% |
| Maximum | 28.1% | 37.3% |
| Range | 27.6% | 35.7% |
| Mean | 9.1% | 10.4% |
| Median | 8.4% | 8.7% |
| Interquartile 25% (IQ1) | 6.6% | 6.4% |
| Interquartile 75% (IQ3) | 10.7% | 12.0% |
| Interquartile Range (IQR) | 4.1% | 5.6% |
| Standard Deviation (Sample) | 4.8% | 6.7% |
| Standard Deviation (Population) | 4.7% | 6.6% |
Similar Demographics by Unemployment Among Women with Children Ages 6 to 17 years
Demographics Similar to Immigrants from Western Asia by Unemployment Among Women with Children Ages 6 to 17 years
In terms of unemployment among women with children ages 6 to 17 years, the demographic groups most similar to Immigrants from Western Asia are Barbadian (8.7%, a difference of 0.14%), Slavic (8.7%, a difference of 0.15%), Yaqui (8.7%, a difference of 0.16%), Egyptian (8.7%, a difference of 0.22%), and Hmong (8.7%, a difference of 0.24%).
| Demographics | Rating | Rank | Unemployment Among Women with Children Ages 6 to 17 years |
| Immigrants | Morocco | 94.9 /100 | #123 | Exceptional 8.7% |
| Immigrants | Lebanon | 94.9 /100 | #124 | Exceptional 8.7% |
| South Africans | 94.6 /100 | #125 | Exceptional 8.7% |
| Immigrants | Northern Africa | 94.4 /100 | #126 | Exceptional 8.7% |
| Czechs | 94.4 /100 | #127 | Exceptional 8.7% |
| Hmong | 94.3 /100 | #128 | Exceptional 8.7% |
| Barbadians | 93.8 /100 | #129 | Exceptional 8.7% |
| Immigrants | Western Asia | 93.1 /100 | #130 | Exceptional 8.7% |
| Slavs | 92.2 /100 | #131 | Exceptional 8.7% |
| Yaqui | 92.2 /100 | #132 | Exceptional 8.7% |
| Egyptians | 91.8 /100 | #133 | Exceptional 8.7% |
| Immigrants | Ireland | 91.0 /100 | #134 | Exceptional 8.7% |
| Europeans | 90.6 /100 | #135 | Exceptional 8.7% |
| Immigrants | Latvia | 90.4 /100 | #136 | Exceptional 8.7% |
| Immigrants | Argentina | 90.0 /100 | #137 | Excellent 8.7% |
Demographics Similar to Trinidadians and Tobagonians by Unemployment Among Women with Children Ages 6 to 17 years
In terms of unemployment among women with children ages 6 to 17 years, the demographic groups most similar to Trinidadians and Tobagonians are Immigrants from Trinidad and Tobago (9.1%, a difference of 0.11%), Czechoslovakian (9.1%, a difference of 0.18%), Immigrants from Middle Africa (9.1%, a difference of 0.20%), Maltese (9.1%, a difference of 0.22%), and Immigrants from Canada (9.1%, a difference of 0.23%).
| Demographics | Rating | Rank | Unemployment Among Women with Children Ages 6 to 17 years |
| Immigrants | Turkey | 25.8 /100 | #193 | Fair 9.1% |
| Immigrants | Kazakhstan | 25.3 /100 | #194 | Fair 9.1% |
| Austrians | 25.0 /100 | #195 | Fair 9.1% |
| Brazilians | 24.4 /100 | #196 | Fair 9.1% |
| Immigrants | Panama | 24.3 /100 | #197 | Fair 9.1% |
| Guyanese | 21.8 /100 | #198 | Fair 9.1% |
| Czechoslovakians | 20.8 /100 | #199 | Fair 9.1% |
| Trinidadians and Tobagonians | 18.2 /100 | #200 | Poor 9.1% |
| Immigrants | Trinidad and Tobago | 16.7 /100 | #201 | Poor 9.1% |
| Immigrants | Middle Africa | 15.6 /100 | #202 | Poor 9.1% |
| Maltese | 15.3 /100 | #203 | Poor 9.1% |
| Immigrants | Canada | 15.3 /100 | #204 | Poor 9.1% |
| Immigrants | Western Europe | 14.1 /100 | #205 | Poor 9.1% |
| Immigrants | North America | 12.7 /100 | #206 | Poor 9.2% |
| Cubans | 10.9 /100 | #207 | Poor 9.2% |