Immigrants from Lebanon vs Puget Sound Salish In Labor Force | Age 20-64
COMPARE
Immigrants from Lebanon
Puget Sound Salish
In Labor Force | Age 20-64
In Labor Force | Age 20-64 Comparison
Immigrants from Lebanon
Puget Sound Salish
78.7%
IN LABOR FORCE | AGE 20-64
0.5/ 100
METRIC RATING
254th/ 347
METRIC RANK
78.2%
IN LABOR FORCE | AGE 20-64
0.0/ 100
METRIC RATING
276th/ 347
METRIC RANK
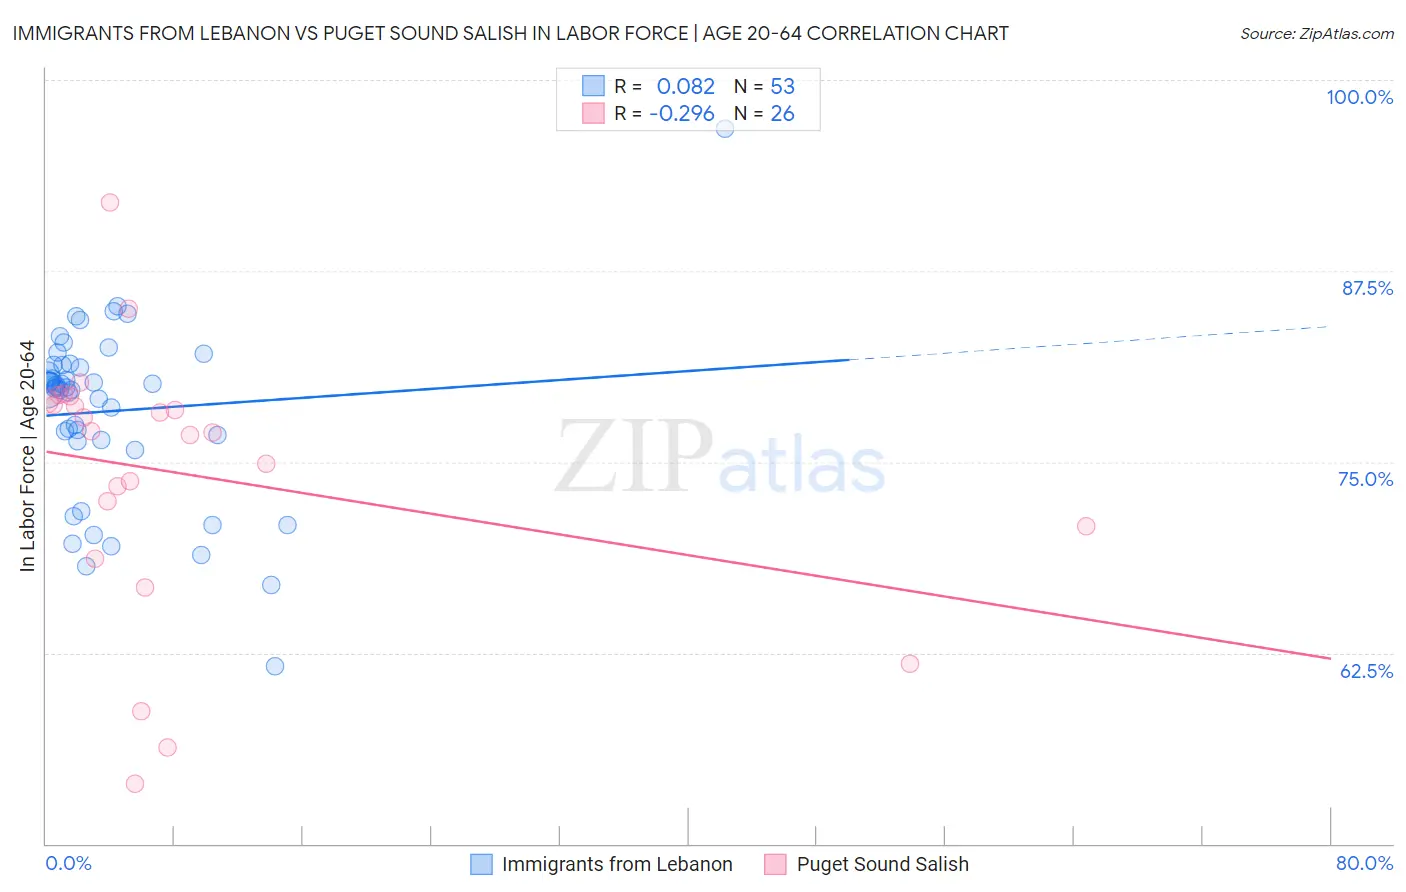
Immigrants from Lebanon vs Puget Sound Salish In Labor Force | Age 20-64 Correlation Chart
The statistical analysis conducted on geographies consisting of 217,153,550 people shows a slight positive correlation between the proportion of Immigrants from Lebanon and labor force participation rate among population between the ages 20 and 64 in the United States with a correlation coefficient (R) of 0.082 and weighted average of 78.7%. Similarly, the statistical analysis conducted on geographies consisting of 46,155,865 people shows a weak negative correlation between the proportion of Puget Sound Salish and labor force participation rate among population between the ages 20 and 64 in the United States with a correlation coefficient (R) of -0.296 and weighted average of 78.2%, a difference of 0.67%.
In Labor Force | Age 20-64 Correlation Summary
| Measurement | Immigrants from Lebanon | Puget Sound Salish |
| Minimum | 61.6% | 53.9% |
| Maximum | 96.8% | 92.0% |
| Range | 35.2% | 38.1% |
| Mean | 78.3% | 74.2% |
| Median | 79.8% | 77.0% |
| Interquartile 25% (IQ1) | 76.4% | 70.8% |
| Interquartile 75% (IQ3) | 81.4% | 79.0% |
| Interquartile Range (IQR) | 5.0% | 8.2% |
| Standard Deviation (Sample) | 5.8% | 8.7% |
| Standard Deviation (Population) | 5.8% | 8.6% |
Similar Demographics by In Labor Force | Age 20-64
Demographics Similar to Immigrants from Lebanon by In Labor Force | Age 20-64
In terms of in labor force | age 20-64, the demographic groups most similar to Immigrants from Lebanon are Basque (78.7%, a difference of 0.0%), Immigrants from Honduras (78.7%, a difference of 0.010%), Hawaiian (78.7%, a difference of 0.020%), Celtic (78.7%, a difference of 0.020%), and Guatemalan (78.7%, a difference of 0.040%).
| Demographics | Rating | Rank | In Labor Force | Age 20-64 |
| Immigrants | Germany | 1.0 /100 | #247 | Tragic 78.8% |
| Immigrants | Caribbean | 1.0 /100 | #248 | Tragic 78.8% |
| English | 0.9 /100 | #249 | Tragic 78.8% |
| Hondurans | 0.8 /100 | #250 | Tragic 78.8% |
| Barbadians | 0.7 /100 | #251 | Tragic 78.8% |
| Immigrants | Honduras | 0.6 /100 | #252 | Tragic 78.7% |
| Basques | 0.5 /100 | #253 | Tragic 78.7% |
| Immigrants | Lebanon | 0.5 /100 | #254 | Tragic 78.7% |
| Hawaiians | 0.5 /100 | #255 | Tragic 78.7% |
| Celtics | 0.5 /100 | #256 | Tragic 78.7% |
| Guatemalans | 0.4 /100 | #257 | Tragic 78.7% |
| Immigrants | Guatemala | 0.4 /100 | #258 | Tragic 78.7% |
| Tsimshian | 0.4 /100 | #259 | Tragic 78.7% |
| Immigrants | Fiji | 0.3 /100 | #260 | Tragic 78.6% |
| Whites/Caucasians | 0.2 /100 | #261 | Tragic 78.5% |
Demographics Similar to Puget Sound Salish by In Labor Force | Age 20-64
In terms of in labor force | age 20-64, the demographic groups most similar to Puget Sound Salish are Spanish (78.2%, a difference of 0.0%), Aleut (78.2%, a difference of 0.010%), Immigrants from Bahamas (78.2%, a difference of 0.010%), Mexican American Indian (78.2%, a difference of 0.020%), and French American Indian (78.2%, a difference of 0.030%).
| Demographics | Rating | Rank | In Labor Force | Age 20-64 |
| Immigrants | Barbados | 0.0 /100 | #269 | Tragic 78.3% |
| Scotch-Irish | 0.0 /100 | #270 | Tragic 78.3% |
| Immigrants | Latin America | 0.0 /100 | #271 | Tragic 78.3% |
| Marshallese | 0.0 /100 | #272 | Tragic 78.3% |
| French American Indians | 0.0 /100 | #273 | Tragic 78.2% |
| Aleuts | 0.0 /100 | #274 | Tragic 78.2% |
| Spanish | 0.0 /100 | #275 | Tragic 78.2% |
| Puget Sound Salish | 0.0 /100 | #276 | Tragic 78.2% |
| Immigrants | Bahamas | 0.0 /100 | #277 | Tragic 78.2% |
| Mexican American Indians | 0.0 /100 | #278 | Tragic 78.2% |
| Belizeans | 0.0 /100 | #279 | Tragic 78.2% |
| Immigrants | Dominica | 0.0 /100 | #280 | Tragic 78.1% |
| Guyanese | 0.0 /100 | #281 | Tragic 78.1% |
| Immigrants | St. Vincent and the Grenadines | 0.0 /100 | #282 | Tragic 78.1% |
| Immigrants | Nonimmigrants | 0.0 /100 | #283 | Tragic 78.1% |