Immigrants from Israel vs Puget Sound Salish In Labor Force | Age 20-64
COMPARE
Immigrants from Israel
Puget Sound Salish
In Labor Force | Age 20-64
In Labor Force | Age 20-64 Comparison
Immigrants from Israel
Puget Sound Salish
79.8%
IN LABOR FORCE | AGE 20-64
80.0/ 100
METRIC RATING
141st/ 347
METRIC RANK
78.2%
IN LABOR FORCE | AGE 20-64
0.0/ 100
METRIC RATING
276th/ 347
METRIC RANK
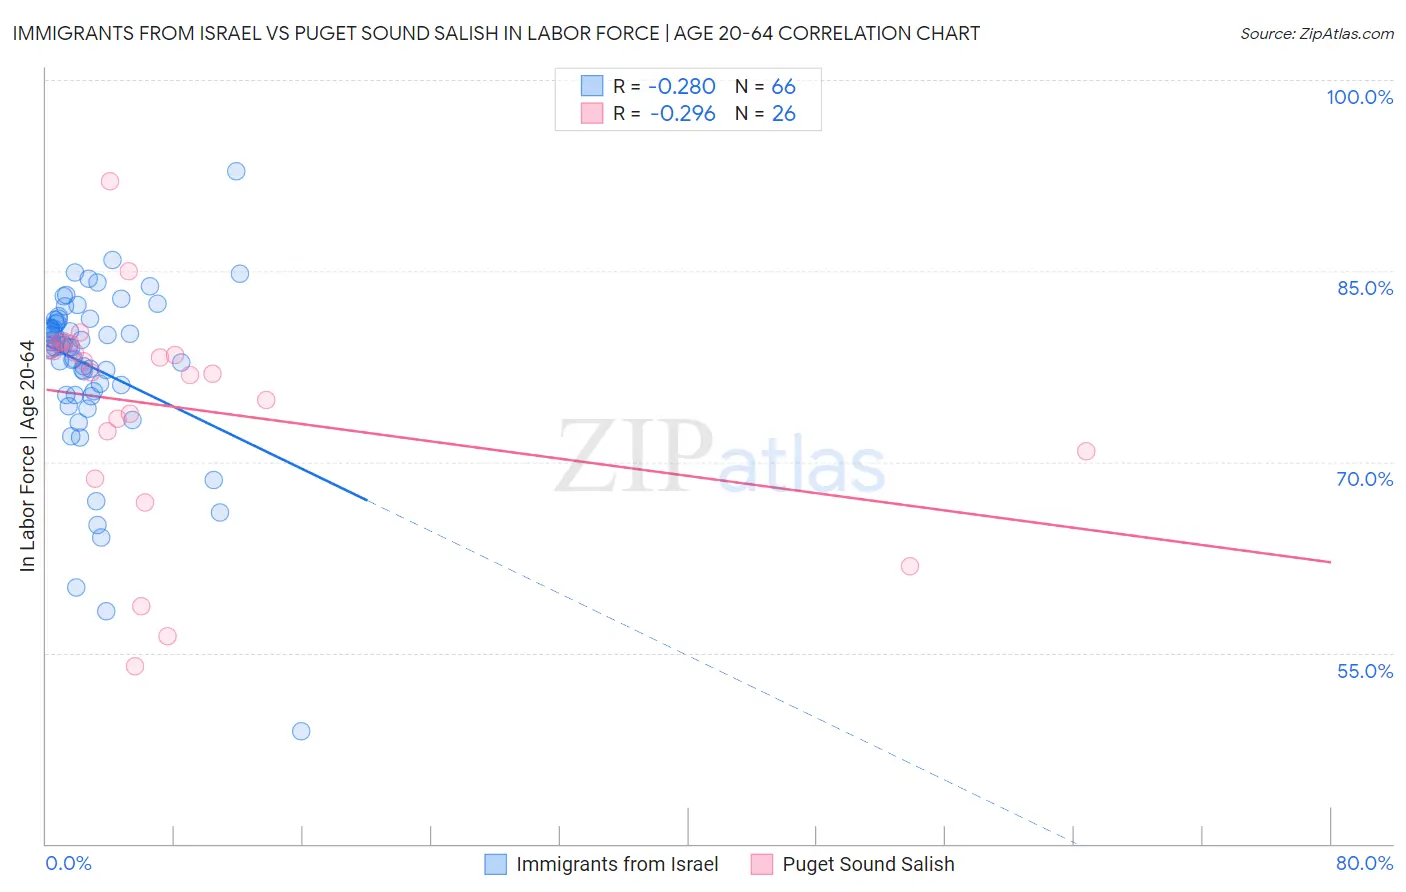
Immigrants from Israel vs Puget Sound Salish In Labor Force | Age 20-64 Correlation Chart
The statistical analysis conducted on geographies consisting of 210,029,528 people shows a weak negative correlation between the proportion of Immigrants from Israel and labor force participation rate among population between the ages 20 and 64 in the United States with a correlation coefficient (R) of -0.280 and weighted average of 79.8%. Similarly, the statistical analysis conducted on geographies consisting of 46,155,865 people shows a weak negative correlation between the proportion of Puget Sound Salish and labor force participation rate among population between the ages 20 and 64 in the United States with a correlation coefficient (R) of -0.296 and weighted average of 78.2%, a difference of 2.0%.
In Labor Force | Age 20-64 Correlation Summary
| Measurement | Immigrants from Israel | Puget Sound Salish |
| Minimum | 48.8% | 53.9% |
| Maximum | 92.8% | 92.0% |
| Range | 44.0% | 38.1% |
| Mean | 77.4% | 74.2% |
| Median | 79.1% | 77.0% |
| Interquartile 25% (IQ1) | 75.3% | 70.8% |
| Interquartile 75% (IQ3) | 81.2% | 79.0% |
| Interquartile Range (IQR) | 5.9% | 8.2% |
| Standard Deviation (Sample) | 7.0% | 8.7% |
| Standard Deviation (Population) | 6.9% | 8.6% |
Similar Demographics by In Labor Force | Age 20-64
Demographics Similar to Immigrants from Israel by In Labor Force | Age 20-64
In terms of in labor force | age 20-64, the demographic groups most similar to Immigrants from Israel are Immigrants from South Eastern Asia (79.8%, a difference of 0.0%), Slovak (79.8%, a difference of 0.0%), Immigrants from Sweden (79.8%, a difference of 0.0%), Korean (79.8%, a difference of 0.0%), and Pakistani (79.8%, a difference of 0.010%).
| Demographics | Rating | Rank | In Labor Force | Age 20-64 |
| Belgians | 87.4 /100 | #134 | Excellent 79.9% |
| Ukrainians | 86.8 /100 | #135 | Excellent 79.9% |
| Immigrants | Singapore | 86.7 /100 | #136 | Excellent 79.9% |
| Immigrants | Ukraine | 86.5 /100 | #137 | Excellent 79.9% |
| Immigrants | Nigeria | 86.4 /100 | #138 | Excellent 79.9% |
| Immigrants | Spain | 83.9 /100 | #139 | Excellent 79.8% |
| Immigrants | South Eastern Asia | 80.4 /100 | #140 | Excellent 79.8% |
| Immigrants | Israel | 80.0 /100 | #141 | Good 79.8% |
| Slovaks | 79.9 /100 | #142 | Good 79.8% |
| Immigrants | Sweden | 79.7 /100 | #143 | Good 79.8% |
| Koreans | 79.6 /100 | #144 | Good 79.8% |
| Pakistanis | 79.3 /100 | #145 | Good 79.8% |
| Immigrants | Southern Europe | 78.9 /100 | #146 | Good 79.8% |
| Immigrants | Philippines | 78.0 /100 | #147 | Good 79.8% |
| Romanians | 77.6 /100 | #148 | Good 79.8% |
Demographics Similar to Puget Sound Salish by In Labor Force | Age 20-64
In terms of in labor force | age 20-64, the demographic groups most similar to Puget Sound Salish are Spanish (78.2%, a difference of 0.0%), Aleut (78.2%, a difference of 0.010%), Immigrants from Bahamas (78.2%, a difference of 0.010%), Mexican American Indian (78.2%, a difference of 0.020%), and French American Indian (78.2%, a difference of 0.030%).
| Demographics | Rating | Rank | In Labor Force | Age 20-64 |
| Immigrants | Barbados | 0.0 /100 | #269 | Tragic 78.3% |
| Scotch-Irish | 0.0 /100 | #270 | Tragic 78.3% |
| Immigrants | Latin America | 0.0 /100 | #271 | Tragic 78.3% |
| Marshallese | 0.0 /100 | #272 | Tragic 78.3% |
| French American Indians | 0.0 /100 | #273 | Tragic 78.2% |
| Aleuts | 0.0 /100 | #274 | Tragic 78.2% |
| Spanish | 0.0 /100 | #275 | Tragic 78.2% |
| Puget Sound Salish | 0.0 /100 | #276 | Tragic 78.2% |
| Immigrants | Bahamas | 0.0 /100 | #277 | Tragic 78.2% |
| Mexican American Indians | 0.0 /100 | #278 | Tragic 78.2% |
| Belizeans | 0.0 /100 | #279 | Tragic 78.2% |
| Immigrants | Dominica | 0.0 /100 | #280 | Tragic 78.1% |
| Guyanese | 0.0 /100 | #281 | Tragic 78.1% |
| Immigrants | St. Vincent and the Grenadines | 0.0 /100 | #282 | Tragic 78.1% |
| Immigrants | Nonimmigrants | 0.0 /100 | #283 | Tragic 78.1% |