Immigrants from Western Asia vs Macedonian In Labor Force | Age 25-29
COMPARE
Immigrants from Western Asia
Macedonian
In Labor Force | Age 25-29
In Labor Force | Age 25-29 Comparison
Immigrants from Western Asia
Macedonians
84.1%
IN LABOR FORCE | AGE 25-29
2.7/ 100
METRIC RATING
233rd/ 347
METRIC RANK
85.7%
IN LABOR FORCE | AGE 25-29
99.9/ 100
METRIC RATING
44th/ 347
METRIC RANK
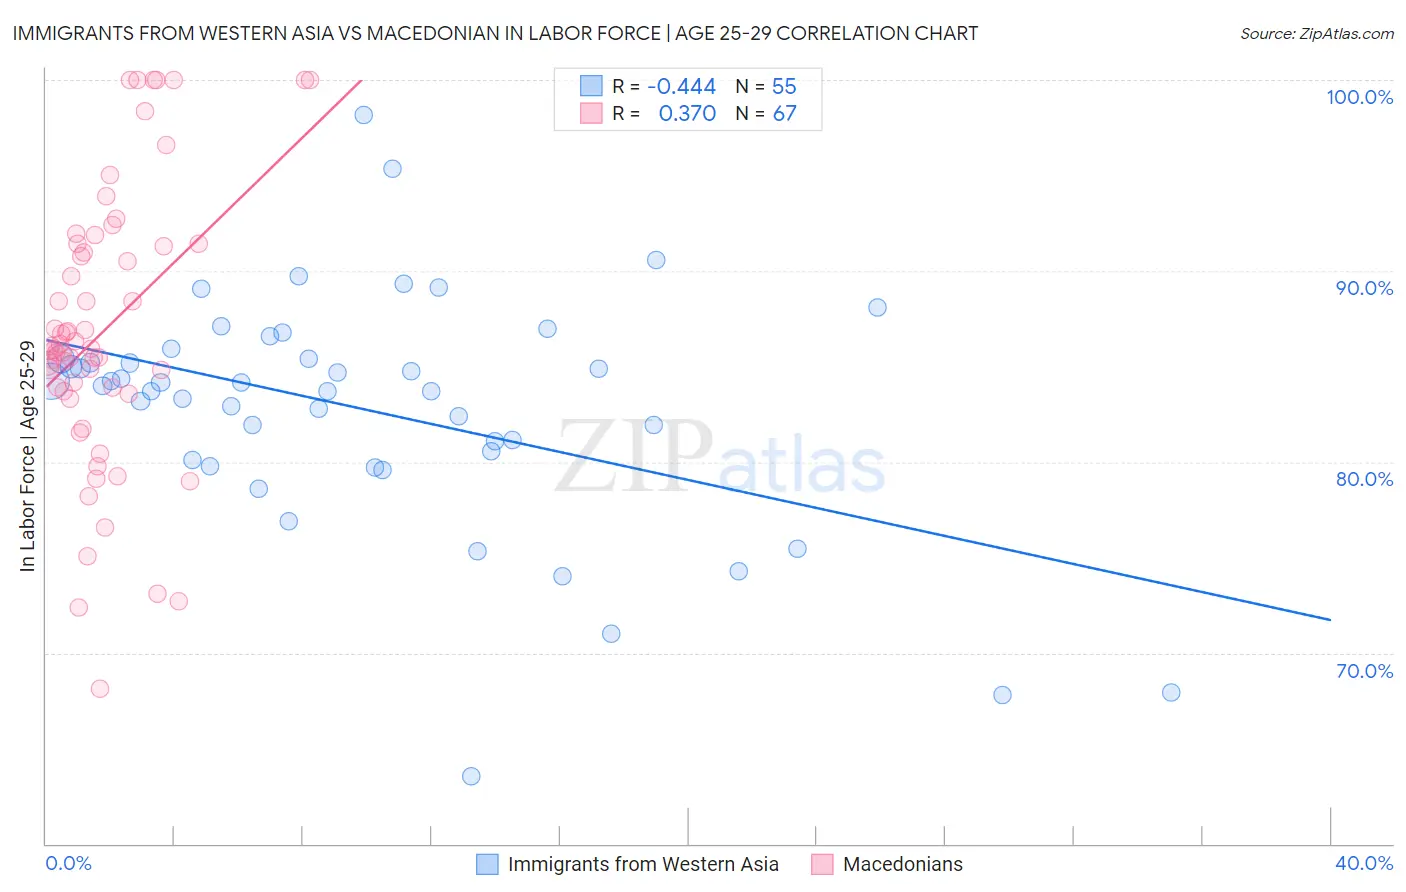
Immigrants from Western Asia vs Macedonian In Labor Force | Age 25-29 Correlation Chart
The statistical analysis conducted on geographies consisting of 404,303,422 people shows a moderate negative correlation between the proportion of Immigrants from Western Asia and labor force participation rate among population between the ages 25 and 29 in the United States with a correlation coefficient (R) of -0.444 and weighted average of 84.1%. Similarly, the statistical analysis conducted on geographies consisting of 132,648,005 people shows a mild positive correlation between the proportion of Macedonians and labor force participation rate among population between the ages 25 and 29 in the United States with a correlation coefficient (R) of 0.370 and weighted average of 85.7%, a difference of 1.9%.
In Labor Force | Age 25-29 Correlation Summary
| Measurement | Immigrants from Western Asia | Macedonian |
| Minimum | 63.5% | 68.1% |
| Maximum | 98.1% | 100.0% |
| Range | 34.6% | 31.9% |
| Mean | 82.7% | 86.9% |
| Median | 84.0% | 85.9% |
| Interquartile 25% (IQ1) | 80.1% | 83.7% |
| Interquartile 75% (IQ3) | 85.4% | 91.4% |
| Interquartile Range (IQR) | 5.3% | 7.7% |
| Standard Deviation (Sample) | 6.2% | 7.3% |
| Standard Deviation (Population) | 6.2% | 7.2% |
Similar Demographics by In Labor Force | Age 25-29
Demographics Similar to Immigrants from Western Asia by In Labor Force | Age 25-29
In terms of in labor force | age 25-29, the demographic groups most similar to Immigrants from Western Asia are Panamanian (84.2%, a difference of 0.10%), White/Caucasian (84.2%, a difference of 0.11%), Immigrants from Philippines (84.2%, a difference of 0.11%), Immigrants from Oceania (84.2%, a difference of 0.12%), and French American Indian (84.2%, a difference of 0.14%).
| Demographics | Rating | Rank | In Labor Force | Age 25-29 |
| Immigrants | Congo | 5.8 /100 | #226 | Tragic 84.2% |
| French American Indians | 5.5 /100 | #227 | Tragic 84.2% |
| Immigrants | Panama | 5.5 /100 | #228 | Tragic 84.2% |
| Immigrants | Oceania | 5.0 /100 | #229 | Tragic 84.2% |
| Whites/Caucasians | 4.8 /100 | #230 | Tragic 84.2% |
| Immigrants | Philippines | 4.7 /100 | #231 | Tragic 84.2% |
| Panamanians | 4.5 /100 | #232 | Tragic 84.2% |
| Immigrants | Western Asia | 2.7 /100 | #233 | Tragic 84.1% |
| Barbadians | 1.0 /100 | #234 | Tragic 83.9% |
| Iraqis | 0.9 /100 | #235 | Tragic 83.9% |
| Guamanians/Chamorros | 0.9 /100 | #236 | Tragic 83.9% |
| Immigrants | Immigrants | 0.9 /100 | #237 | Tragic 83.9% |
| Immigrants | Uzbekistan | 0.8 /100 | #238 | Tragic 83.9% |
| Jamaicans | 0.8 /100 | #239 | Tragic 83.9% |
| Trinidadians and Tobagonians | 0.7 /100 | #240 | Tragic 83.9% |
Demographics Similar to Macedonians by In Labor Force | Age 25-29
In terms of in labor force | age 25-29, the demographic groups most similar to Macedonians are Immigrants from Sierra Leone (85.7%, a difference of 0.0%), Immigrants from India (85.7%, a difference of 0.010%), Immigrants from Eritrea (85.7%, a difference of 0.020%), Czech (85.6%, a difference of 0.030%), and Immigrants from Greece (85.7%, a difference of 0.060%).
| Demographics | Rating | Rank | In Labor Force | Age 25-29 |
| Poles | 99.9 /100 | #37 | Exceptional 85.8% |
| Sierra Leoneans | 99.9 /100 | #38 | Exceptional 85.8% |
| Croatians | 99.9 /100 | #39 | Exceptional 85.8% |
| Immigrants | Albania | 99.9 /100 | #40 | Exceptional 85.7% |
| Immigrants | Greece | 99.9 /100 | #41 | Exceptional 85.7% |
| Immigrants | Eritrea | 99.9 /100 | #42 | Exceptional 85.7% |
| Immigrants | India | 99.9 /100 | #43 | Exceptional 85.7% |
| Macedonians | 99.9 /100 | #44 | Exceptional 85.7% |
| Immigrants | Sierra Leone | 99.9 /100 | #45 | Exceptional 85.7% |
| Czechs | 99.8 /100 | #46 | Exceptional 85.6% |
| Turks | 99.8 /100 | #47 | Exceptional 85.6% |
| Italians | 99.8 /100 | #48 | Exceptional 85.6% |
| Swedes | 99.8 /100 | #49 | Exceptional 85.6% |
| Yugoslavians | 99.8 /100 | #50 | Exceptional 85.6% |
| Immigrants | Latvia | 99.8 /100 | #51 | Exceptional 85.6% |