Immigrants from Venezuela vs Cuban Male Poverty
COMPARE
Immigrants from Venezuela
Cuban
Male Poverty
Male Poverty Comparison
Immigrants from Venezuela
Cubans
11.0%
MALE POVERTY
67.9/ 100
METRIC RATING
149th/ 347
METRIC RANK
12.4%
MALE POVERTY
1.3/ 100
METRIC RATING
229th/ 347
METRIC RANK
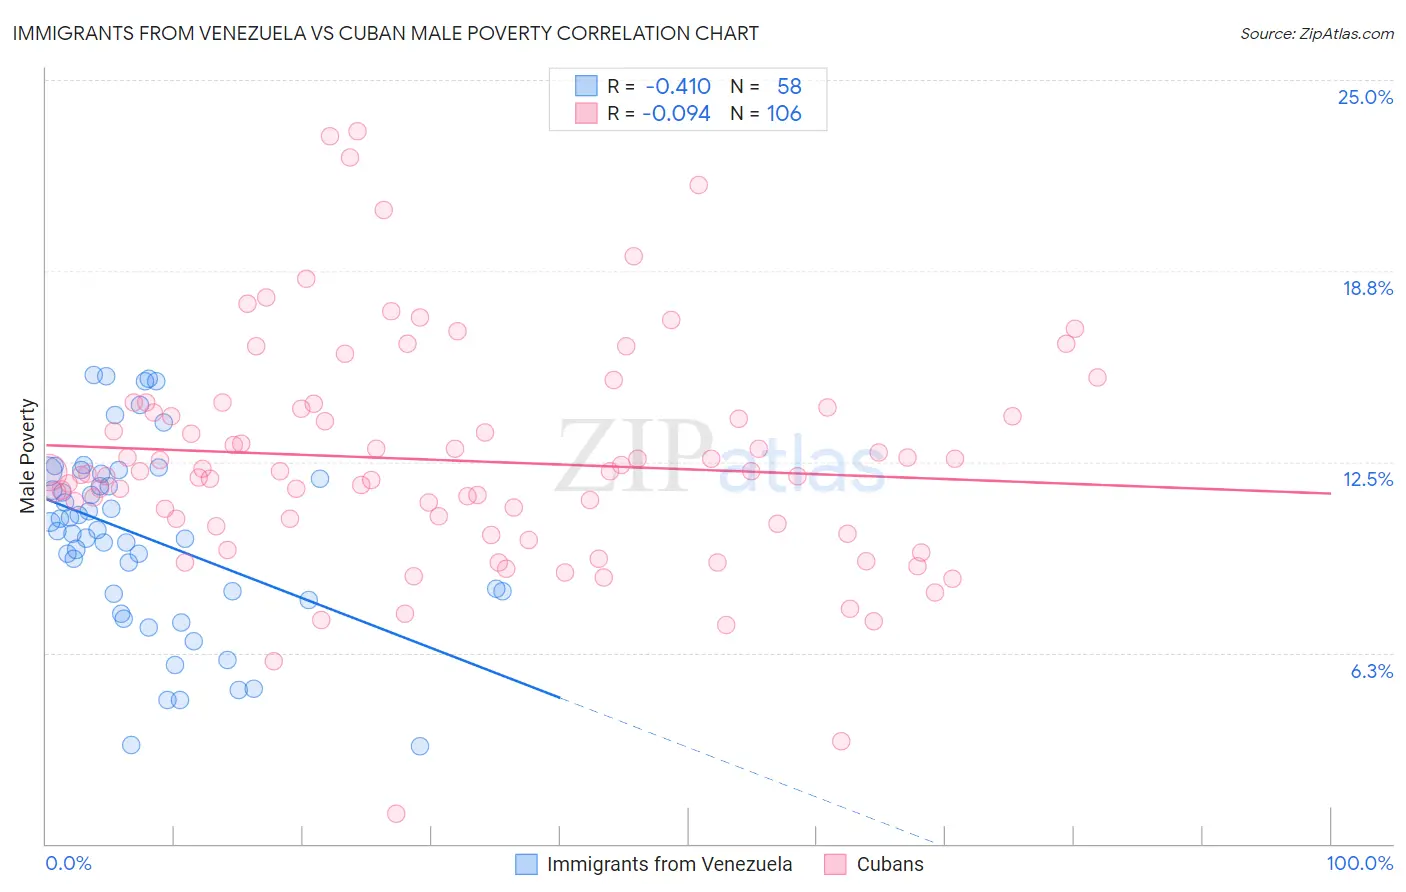
Immigrants from Venezuela vs Cuban Male Poverty Correlation Chart
The statistical analysis conducted on geographies consisting of 287,626,289 people shows a moderate negative correlation between the proportion of Immigrants from Venezuela and poverty level among males in the United States with a correlation coefficient (R) of -0.410 and weighted average of 11.0%. Similarly, the statistical analysis conducted on geographies consisting of 448,765,698 people shows a slight negative correlation between the proportion of Cubans and poverty level among males in the United States with a correlation coefficient (R) of -0.094 and weighted average of 12.4%, a difference of 12.7%.
Male Poverty Correlation Summary
| Measurement | Immigrants from Venezuela | Cuban |
| Minimum | 3.2% | 0.97% |
| Maximum | 15.3% | 23.3% |
| Range | 12.2% | 22.4% |
| Mean | 10.0% | 12.5% |
| Median | 10.2% | 12.2% |
| Interquartile 25% (IQ1) | 8.2% | 10.5% |
| Interquartile 75% (IQ3) | 12.1% | 14.2% |
| Interquartile Range (IQR) | 3.9% | 3.8% |
| Standard Deviation (Sample) | 3.1% | 3.7% |
| Standard Deviation (Population) | 3.0% | 3.7% |
Similar Demographics by Male Poverty
Demographics Similar to Immigrants from Venezuela by Male Poverty
In terms of male poverty, the demographic groups most similar to Immigrants from Venezuela are Armenian (11.0%, a difference of 0.020%), Guamanian/Chamorro (11.0%, a difference of 0.040%), Venezuelan (11.0%, a difference of 0.060%), Icelander (11.0%, a difference of 0.070%), and Immigrants from Nepal (11.0%, a difference of 0.070%).
| Demographics | Rating | Rank | Male Poverty |
| Basques | 74.6 /100 | #142 | Good 10.9% |
| Afghans | 71.9 /100 | #143 | Good 10.9% |
| Samoans | 71.8 /100 | #144 | Good 10.9% |
| Immigrants | Germany | 71.6 /100 | #145 | Good 10.9% |
| Syrians | 71.4 /100 | #146 | Good 10.9% |
| Icelanders | 68.5 /100 | #147 | Good 11.0% |
| Armenians | 68.0 /100 | #148 | Good 11.0% |
| Immigrants | Venezuela | 67.9 /100 | #149 | Good 11.0% |
| Guamanians/Chamorros | 67.6 /100 | #150 | Good 11.0% |
| Venezuelans | 67.4 /100 | #151 | Good 11.0% |
| Immigrants | Nepal | 67.3 /100 | #152 | Good 11.0% |
| Immigrants | Bosnia and Herzegovina | 65.2 /100 | #153 | Good 11.0% |
| Immigrants | Kazakhstan | 64.8 /100 | #154 | Good 11.0% |
| Immigrants | Malaysia | 64.7 /100 | #155 | Good 11.0% |
| Costa Ricans | 63.9 /100 | #156 | Good 11.0% |
Demographics Similar to Cubans by Male Poverty
In terms of male poverty, the demographic groups most similar to Cubans are Alsatian (12.4%, a difference of 0.090%), Alaska Native (12.4%, a difference of 0.13%), Nigerian (12.3%, a difference of 0.23%), Osage (12.3%, a difference of 0.39%), and Immigrants from Nigeria (12.3%, a difference of 0.45%).
| Demographics | Rating | Rank | Male Poverty |
| Immigrants | Africa | 2.1 /100 | #222 | Tragic 12.2% |
| Immigrants | Micronesia | 2.1 /100 | #223 | Tragic 12.2% |
| Immigrants | Nigeria | 1.6 /100 | #224 | Tragic 12.3% |
| Osage | 1.5 /100 | #225 | Tragic 12.3% |
| Nigerians | 1.4 /100 | #226 | Tragic 12.3% |
| Alaska Natives | 1.4 /100 | #227 | Tragic 12.4% |
| Alsatians | 1.3 /100 | #228 | Tragic 12.4% |
| Cubans | 1.3 /100 | #229 | Tragic 12.4% |
| Marshallese | 0.8 /100 | #230 | Tragic 12.5% |
| Salvadorans | 0.6 /100 | #231 | Tragic 12.6% |
| Nicaraguans | 0.6 /100 | #232 | Tragic 12.6% |
| Fijians | 0.6 /100 | #233 | Tragic 12.6% |
| Immigrants | Armenia | 0.6 /100 | #234 | Tragic 12.6% |
| Immigrants | Laos | 0.5 /100 | #235 | Tragic 12.6% |
| Immigrants | Saudi Arabia | 0.4 /100 | #236 | Tragic 12.7% |