Immigrants from Venezuela vs Cuban Unemployment Among Youth under 25 years
COMPARE
Immigrants from Venezuela
Cuban
Unemployment Among Youth under 25 years
Unemployment Among Youth under 25 years Comparison
Immigrants from Venezuela
Cubans
10.5%
UNEMPLOYMENT AMONG YOUTH UNDER 25 YEARS
100.0/ 100
METRIC RATING
8th/ 347
METRIC RANK
10.6%
UNEMPLOYMENT AMONG YOUTH UNDER 25 YEARS
100.0/ 100
METRIC RATING
14th/ 347
METRIC RANK
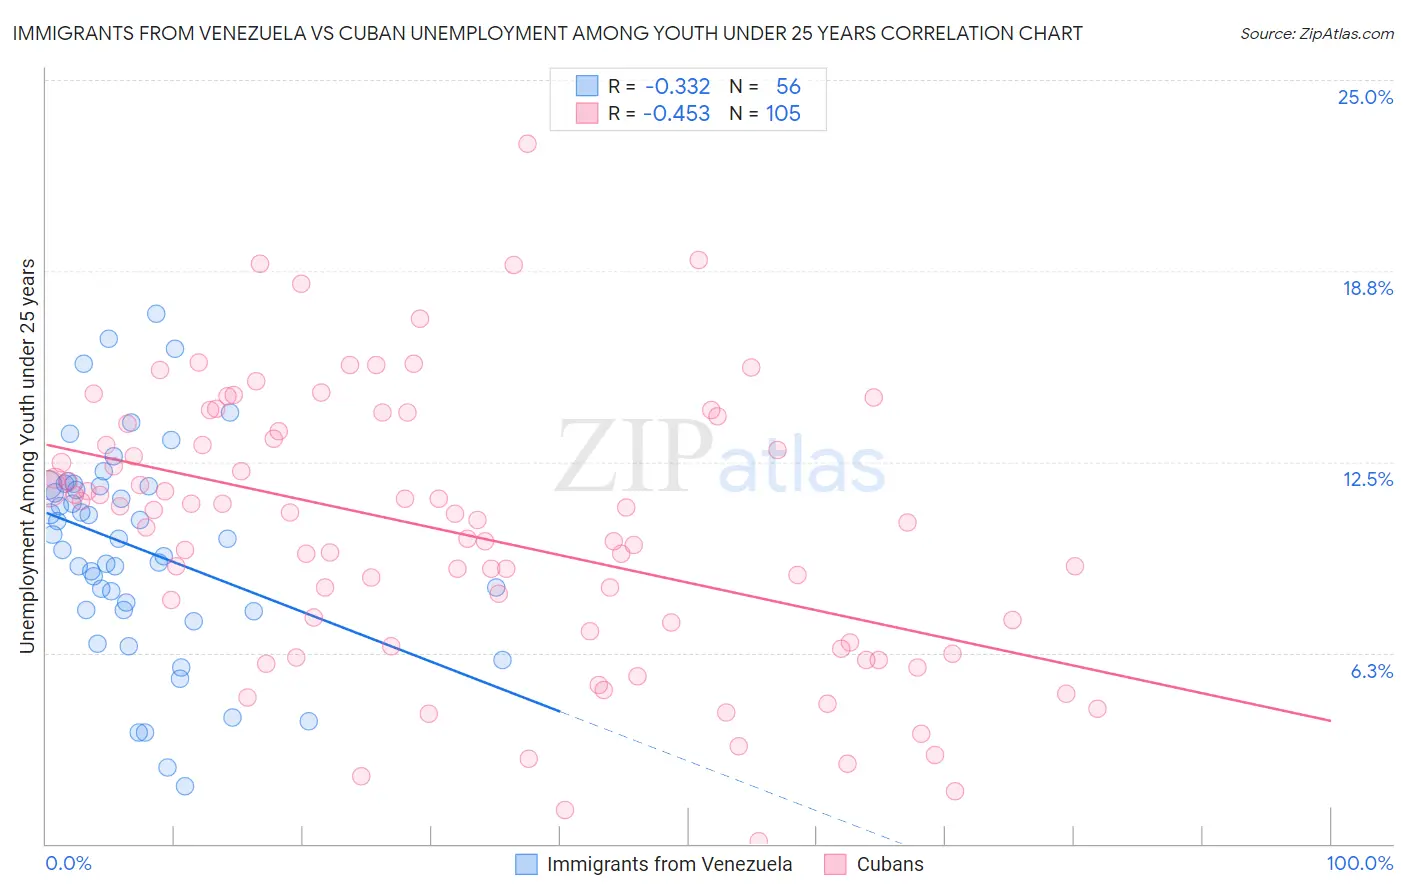
Immigrants from Venezuela vs Cuban Unemployment Among Youth under 25 years Correlation Chart
The statistical analysis conducted on geographies consisting of 286,034,165 people shows a mild negative correlation between the proportion of Immigrants from Venezuela and unemployment rate among youth under the age of 25 in the United States with a correlation coefficient (R) of -0.332 and weighted average of 10.5%. Similarly, the statistical analysis conducted on geographies consisting of 442,540,080 people shows a moderate negative correlation between the proportion of Cubans and unemployment rate among youth under the age of 25 in the United States with a correlation coefficient (R) of -0.453 and weighted average of 10.6%, a difference of 0.87%.
Unemployment Among Youth under 25 years Correlation Summary
| Measurement | Immigrants from Venezuela | Cuban |
| Minimum | 1.9% | 0.10% |
| Maximum | 17.4% | 22.9% |
| Range | 15.5% | 22.8% |
| Mean | 9.7% | 10.2% |
| Median | 10.0% | 10.6% |
| Interquartile 25% (IQ1) | 7.7% | 6.5% |
| Interquartile 75% (IQ3) | 11.7% | 13.4% |
| Interquartile Range (IQR) | 4.1% | 6.8% |
| Standard Deviation (Sample) | 3.4% | 4.5% |
| Standard Deviation (Population) | 3.4% | 4.4% |
Demographics Similar to Immigrants from Venezuela and Cubans by Unemployment Among Youth under 25 years
In terms of unemployment among youth under 25 years, the demographic groups most similar to Immigrants from Venezuela are German (10.5%, a difference of 0.40%), Immigrants from Somalia (10.5%, a difference of 0.42%), Scandinavian (10.5%, a difference of 0.55%), Immigrants from Sudan (10.5%, a difference of 0.73%), and Swedish (10.4%, a difference of 0.78%). Similarly, the demographic groups most similar to Cubans are Indonesian (10.6%, a difference of 0.020%), Sudanese (10.6%, a difference of 0.12%), Venezuelan (10.6%, a difference of 0.12%), Immigrants from Sudan (10.5%, a difference of 0.14%), and Menominee (10.6%, a difference of 0.17%).
| Demographics | Rating | Rank | Unemployment Among Youth under 25 years |
| Norwegians | 100.0 /100 | #1 | Exceptional 9.8% |
| Immigrants | Cuba | 100.0 /100 | #2 | Exceptional 10.0% |
| Luxembourgers | 100.0 /100 | #3 | Exceptional 10.0% |
| Zimbabweans | 100.0 /100 | #4 | Exceptional 10.2% |
| Czechs | 100.0 /100 | #5 | Exceptional 10.3% |
| Danes | 100.0 /100 | #6 | Exceptional 10.3% |
| Swedes | 100.0 /100 | #7 | Exceptional 10.4% |
| Immigrants | Venezuela | 100.0 /100 | #8 | Exceptional 10.5% |
| Germans | 100.0 /100 | #9 | Exceptional 10.5% |
| Immigrants | Somalia | 100.0 /100 | #10 | Exceptional 10.5% |
| Scandinavians | 100.0 /100 | #11 | Exceptional 10.5% |
| Immigrants | Sudan | 100.0 /100 | #12 | Exceptional 10.5% |
| Indonesians | 100.0 /100 | #13 | Exceptional 10.6% |
| Cubans | 100.0 /100 | #14 | Exceptional 10.6% |
| Sudanese | 100.0 /100 | #15 | Exceptional 10.6% |
| Venezuelans | 100.0 /100 | #16 | Exceptional 10.6% |
| Menominee | 100.0 /100 | #17 | Exceptional 10.6% |
| Swiss | 100.0 /100 | #18 | Exceptional 10.6% |
| Immigrants | Burma/Myanmar | 100.0 /100 | #19 | Exceptional 10.6% |
| Dutch | 100.0 /100 | #20 | Exceptional 10.6% |
| Pennsylvania Germans | 100.0 /100 | #21 | Exceptional 10.6% |