Immigrants from Venezuela vs Immigrants from Oceania In Labor Force | Age 25-29
COMPARE
Immigrants from Venezuela
Immigrants from Oceania
In Labor Force | Age 25-29
In Labor Force | Age 25-29 Comparison
Immigrants from Venezuela
Immigrants from Oceania
84.3%
IN LABOR FORCE | AGE 25-29
12.6/ 100
METRIC RATING
211th/ 347
METRIC RANK
84.2%
IN LABOR FORCE | AGE 25-29
5.0/ 100
METRIC RATING
229th/ 347
METRIC RANK
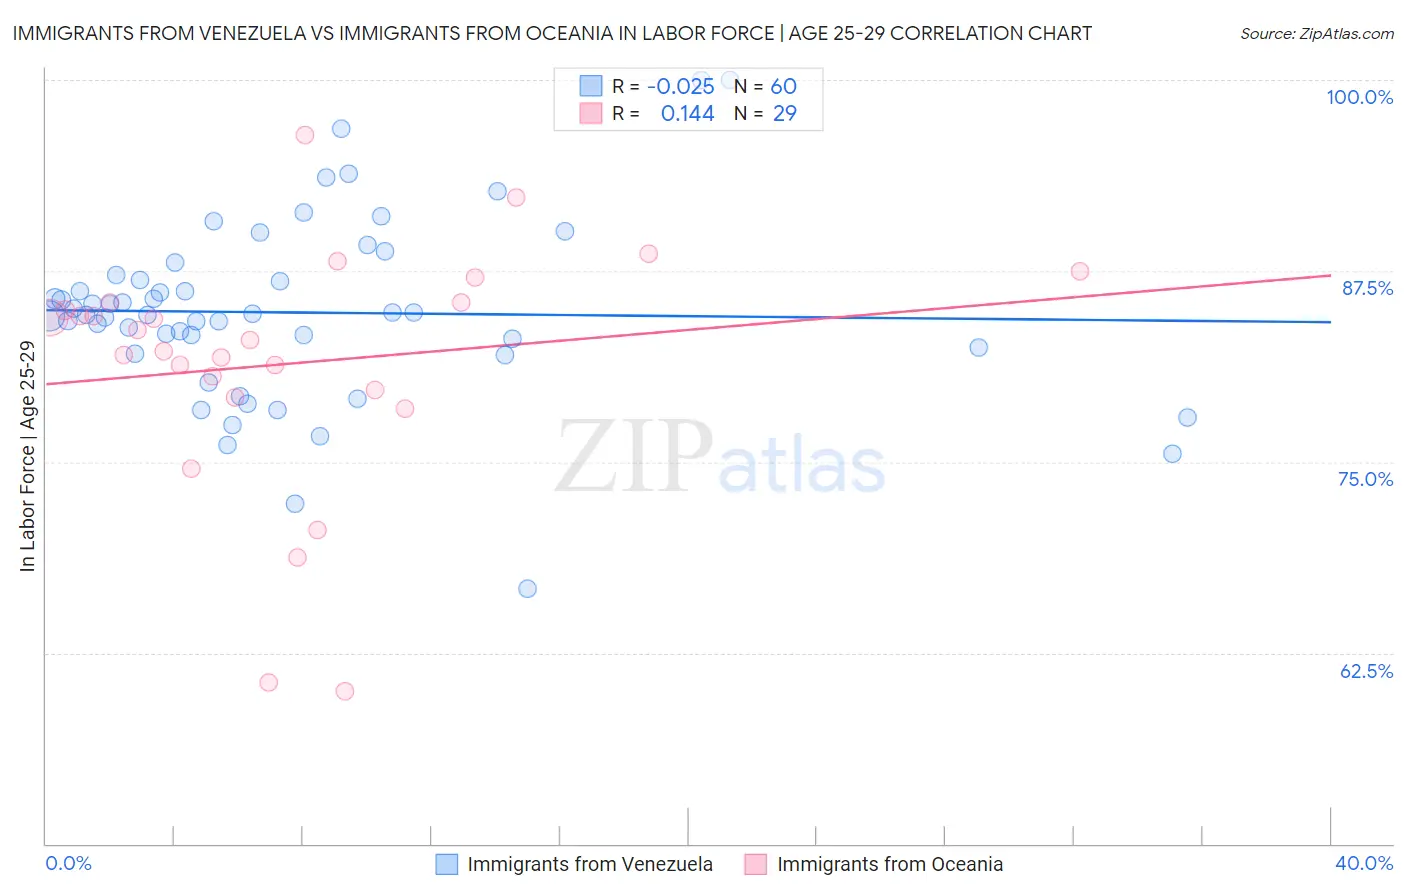
Immigrants from Venezuela vs Immigrants from Oceania In Labor Force | Age 25-29 Correlation Chart
The statistical analysis conducted on geographies consisting of 287,835,027 people shows no correlation between the proportion of Immigrants from Venezuela and labor force participation rate among population between the ages 25 and 29 in the United States with a correlation coefficient (R) of -0.025 and weighted average of 84.3%. Similarly, the statistical analysis conducted on geographies consisting of 305,432,144 people shows a poor positive correlation between the proportion of Immigrants from Oceania and labor force participation rate among population between the ages 25 and 29 in the United States with a correlation coefficient (R) of 0.144 and weighted average of 84.2%, a difference of 0.19%.
In Labor Force | Age 25-29 Correlation Summary
| Measurement | Immigrants from Venezuela | Immigrants from Oceania |
| Minimum | 66.7% | 60.0% |
| Maximum | 100.0% | 96.4% |
| Range | 33.3% | 36.4% |
| Mean | 84.8% | 81.4% |
| Median | 84.7% | 83.0% |
| Interquartile 25% (IQ1) | 82.3% | 79.5% |
| Interquartile 75% (IQ3) | 87.1% | 85.4% |
| Interquartile Range (IQR) | 4.8% | 6.0% |
| Standard Deviation (Sample) | 6.0% | 8.1% |
| Standard Deviation (Population) | 5.9% | 8.0% |
Demographics Similar to Immigrants from Venezuela and Immigrants from Oceania by In Labor Force | Age 25-29
In terms of in labor force | age 25-29, the demographic groups most similar to Immigrants from Venezuela are Chinese (84.3%, a difference of 0.0%), Subsaharan African (84.3%, a difference of 0.020%), Japanese (84.3%, a difference of 0.020%), Lebanese (84.3%, a difference of 0.030%), and Immigrants from Syria (84.3%, a difference of 0.030%). Similarly, the demographic groups most similar to Immigrants from Oceania are White/Caucasian (84.2%, a difference of 0.0%), French American Indian (84.2%, a difference of 0.020%), Immigrants from Panama (84.2%, a difference of 0.020%), Korean (84.2%, a difference of 0.030%), and Immigrants from Congo (84.2%, a difference of 0.030%).
| Demographics | Rating | Rank | In Labor Force | Age 25-29 |
| Chinese | 12.7 /100 | #210 | Poor 84.3% |
| Immigrants | Venezuela | 12.6 /100 | #211 | Poor 84.3% |
| Sub-Saharan Africans | 11.7 /100 | #212 | Poor 84.3% |
| Japanese | 11.4 /100 | #213 | Poor 84.3% |
| Lebanese | 11.1 /100 | #214 | Poor 84.3% |
| Immigrants | Syria | 10.7 /100 | #215 | Poor 84.3% |
| Israelis | 9.3 /100 | #216 | Tragic 84.3% |
| Immigrants | Ecuador | 9.3 /100 | #217 | Tragic 84.3% |
| Immigrants | Nigeria | 9.0 /100 | #218 | Tragic 84.3% |
| Immigrants | Saudi Arabia | 8.8 /100 | #219 | Tragic 84.3% |
| Nigerians | 7.2 /100 | #220 | Tragic 84.3% |
| Arabs | 6.8 /100 | #221 | Tragic 84.2% |
| Jordanians | 6.7 /100 | #222 | Tragic 84.2% |
| Scotch-Irish | 6.5 /100 | #223 | Tragic 84.2% |
| Immigrants | West Indies | 6.0 /100 | #224 | Tragic 84.2% |
| Koreans | 5.9 /100 | #225 | Tragic 84.2% |
| Immigrants | Congo | 5.8 /100 | #226 | Tragic 84.2% |
| French American Indians | 5.5 /100 | #227 | Tragic 84.2% |
| Immigrants | Panama | 5.5 /100 | #228 | Tragic 84.2% |
| Immigrants | Oceania | 5.0 /100 | #229 | Tragic 84.2% |
| Whites/Caucasians | 4.8 /100 | #230 | Tragic 84.2% |