Immigrants from Uzbekistan vs Austrian In Labor Force | Age 16-19
COMPARE
Immigrants from Uzbekistan
Austrian
In Labor Force | Age 16-19
In Labor Force | Age 16-19 Comparison
Immigrants from Uzbekistan
Austrians
29.2%
IN LABOR FORCE | AGE 16-19
0.0/ 100
METRIC RATING
339th/ 347
METRIC RANK
39.5%
IN LABOR FORCE | AGE 16-19
99.8/ 100
METRIC RATING
78th/ 347
METRIC RANK
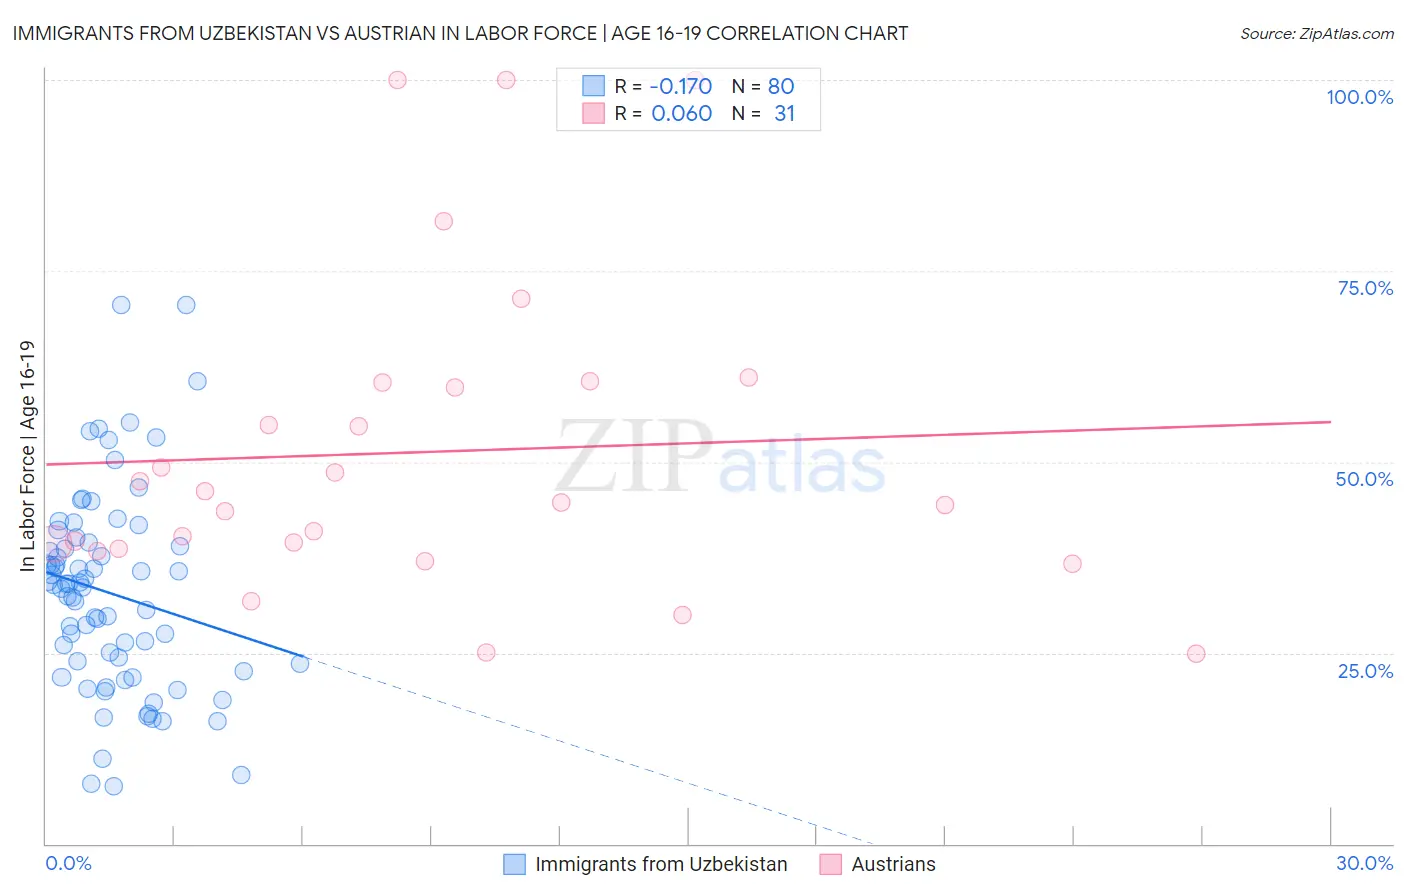
Immigrants from Uzbekistan vs Austrian In Labor Force | Age 16-19 Correlation Chart
The statistical analysis conducted on geographies consisting of 118,707,763 people shows a poor negative correlation between the proportion of Immigrants from Uzbekistan and labor force participation rate among population between the ages 16 and 19 in the United States with a correlation coefficient (R) of -0.170 and weighted average of 29.2%. Similarly, the statistical analysis conducted on geographies consisting of 450,897,610 people shows a slight positive correlation between the proportion of Austrians and labor force participation rate among population between the ages 16 and 19 in the United States with a correlation coefficient (R) of 0.060 and weighted average of 39.5%, a difference of 35.5%.
In Labor Force | Age 16-19 Correlation Summary
| Measurement | Immigrants from Uzbekistan | Austrian |
| Minimum | 7.6% | 24.9% |
| Maximum | 70.6% | 100.0% |
| Range | 63.0% | 75.1% |
| Mean | 32.8% | 51.3% |
| Median | 33.7% | 44.7% |
| Interquartile 25% (IQ1) | 23.1% | 38.6% |
| Interquartile 75% (IQ3) | 39.2% | 60.5% |
| Interquartile Range (IQR) | 16.1% | 21.8% |
| Standard Deviation (Sample) | 13.1% | 20.5% |
| Standard Deviation (Population) | 13.0% | 20.2% |
Similar Demographics by In Labor Force | Age 16-19
Demographics Similar to Immigrants from Uzbekistan by In Labor Force | Age 16-19
In terms of in labor force | age 16-19, the demographic groups most similar to Immigrants from Uzbekistan are British West Indian (29.1%, a difference of 0.20%), Immigrants from Armenia (29.0%, a difference of 0.43%), Immigrants from Barbados (29.0%, a difference of 0.58%), Vietnamese (29.6%, a difference of 1.4%), and Immigrants from Bangladesh (30.0%, a difference of 3.1%).
| Demographics | Rating | Rank | In Labor Force | Age 16-19 |
| Immigrants | Israel | 0.0 /100 | #332 | Tragic 30.5% |
| Immigrants | Hong Kong | 0.0 /100 | #333 | Tragic 30.5% |
| Puerto Ricans | 0.0 /100 | #334 | Tragic 30.3% |
| Immigrants | Cuba | 0.0 /100 | #335 | Tragic 30.2% |
| Immigrants | Trinidad and Tobago | 0.0 /100 | #336 | Tragic 30.2% |
| Immigrants | Bangladesh | 0.0 /100 | #337 | Tragic 30.0% |
| Vietnamese | 0.0 /100 | #338 | Tragic 29.6% |
| Immigrants | Uzbekistan | 0.0 /100 | #339 | Tragic 29.2% |
| British West Indians | 0.0 /100 | #340 | Tragic 29.1% |
| Immigrants | Armenia | 0.0 /100 | #341 | Tragic 29.0% |
| Immigrants | Barbados | 0.0 /100 | #342 | Tragic 29.0% |
| Yuman | 0.0 /100 | #343 | Tragic 27.7% |
| Guyanese | 0.0 /100 | #344 | Tragic 27.4% |
| Immigrants | Guyana | 0.0 /100 | #345 | Tragic 27.3% |
| Immigrants | St. Vincent and the Grenadines | 0.0 /100 | #346 | Tragic 26.3% |
Demographics Similar to Austrians by In Labor Force | Age 16-19
In terms of in labor force | age 16-19, the demographic groups most similar to Austrians are Marshallese (39.5%, a difference of 0.13%), Immigrants from Iraq (39.4%, a difference of 0.31%), Immigrants from Portugal (39.7%, a difference of 0.39%), Malaysian (39.7%, a difference of 0.52%), and Shoshone (39.3%, a difference of 0.59%).
| Demographics | Rating | Rank | In Labor Force | Age 16-19 |
| Serbians | 99.9 /100 | #71 | Exceptional 39.9% |
| Iroquois | 99.9 /100 | #72 | Exceptional 39.9% |
| Immigrants | Middle Africa | 99.9 /100 | #73 | Exceptional 39.9% |
| Hungarians | 99.9 /100 | #74 | Exceptional 39.8% |
| French American Indians | 99.9 /100 | #75 | Exceptional 39.8% |
| Malaysians | 99.9 /100 | #76 | Exceptional 39.7% |
| Immigrants | Portugal | 99.9 /100 | #77 | Exceptional 39.7% |
| Austrians | 99.8 /100 | #78 | Exceptional 39.5% |
| Marshallese | 99.8 /100 | #79 | Exceptional 39.5% |
| Immigrants | Iraq | 99.8 /100 | #80 | Exceptional 39.4% |
| Shoshone | 99.7 /100 | #81 | Exceptional 39.3% |
| Basques | 99.7 /100 | #82 | Exceptional 39.3% |
| Spanish | 99.7 /100 | #83 | Exceptional 39.3% |
| Immigrants | Uganda | 99.7 /100 | #84 | Exceptional 39.2% |
| Creek | 99.6 /100 | #85 | Exceptional 39.1% |