Immigrants from Ukraine vs British In Labor Force | Age > 16
COMPARE
Immigrants from Ukraine
British
In Labor Force | Age > 16
In Labor Force | Age > 16 Comparison
Immigrants from Ukraine
British
65.1%
IN LABOR FORCE | AGE > 16
53.7/ 100
METRIC RATING
173rd/ 347
METRIC RANK
64.7%
IN LABOR FORCE | AGE > 16
7.3/ 100
METRIC RATING
229th/ 347
METRIC RANK
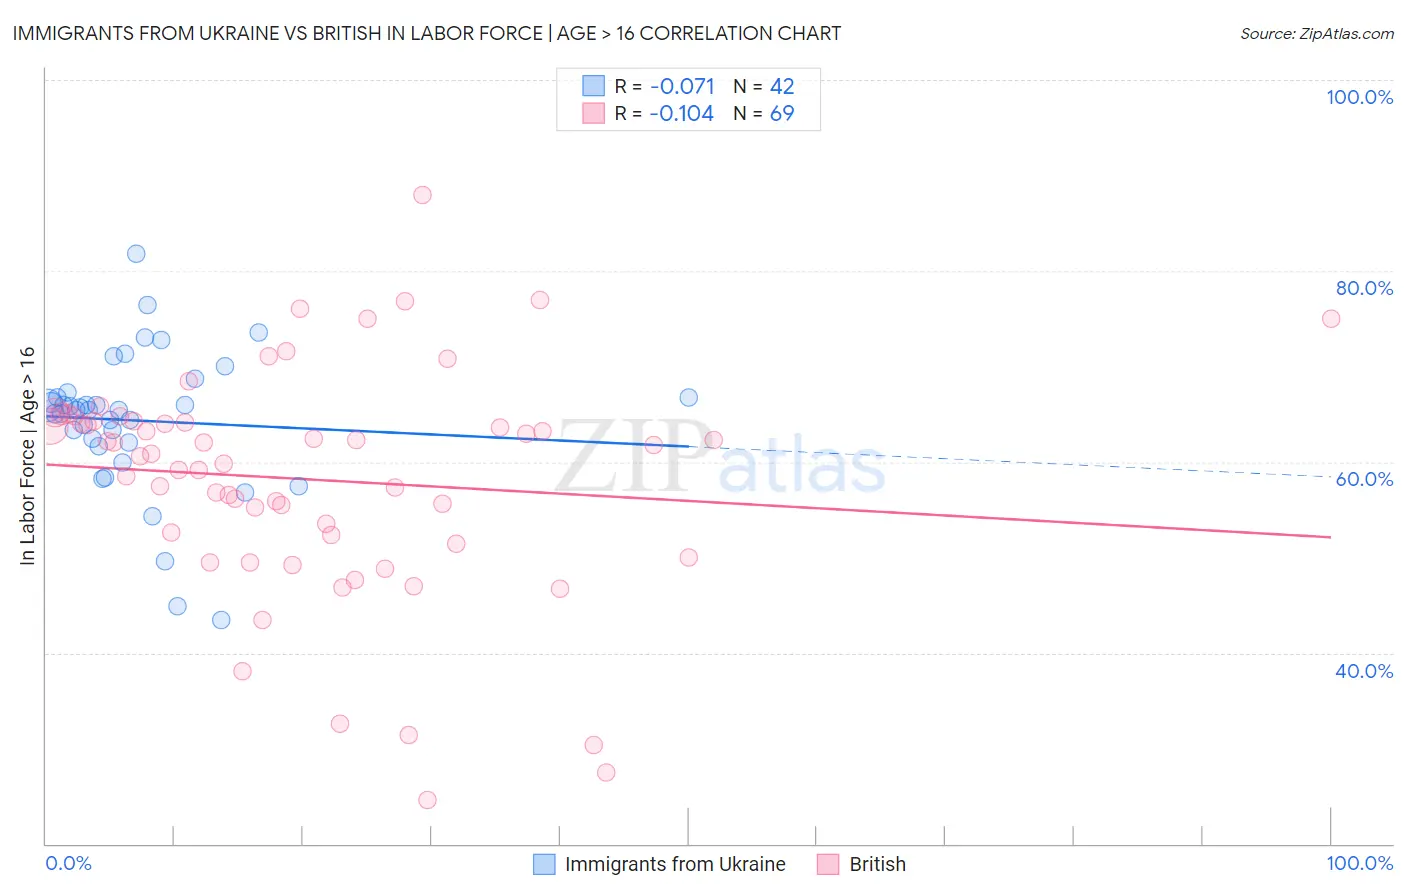
Immigrants from Ukraine vs British In Labor Force | Age > 16 Correlation Chart
The statistical analysis conducted on geographies consisting of 289,705,583 people shows a slight negative correlation between the proportion of Immigrants from Ukraine and labor force participation rate among population ages 16 and over in the United States with a correlation coefficient (R) of -0.071 and weighted average of 65.1%. Similarly, the statistical analysis conducted on geographies consisting of 531,501,445 people shows a poor negative correlation between the proportion of British and labor force participation rate among population ages 16 and over in the United States with a correlation coefficient (R) of -0.104 and weighted average of 64.7%, a difference of 0.76%.
In Labor Force | Age > 16 Correlation Summary
| Measurement | Immigrants from Ukraine | British |
| Minimum | 43.5% | 24.6% |
| Maximum | 81.8% | 87.9% |
| Range | 38.3% | 63.3% |
| Mean | 64.3% | 58.2% |
| Median | 65.5% | 60.9% |
| Interquartile 25% (IQ1) | 62.1% | 51.9% |
| Interquartile 75% (IQ3) | 66.8% | 64.3% |
| Interquartile Range (IQR) | 4.7% | 12.5% |
| Standard Deviation (Sample) | 7.4% | 12.0% |
| Standard Deviation (Population) | 7.3% | 11.9% |
Similar Demographics by In Labor Force | Age > 16
Demographics Similar to Immigrants from Ukraine by In Labor Force | Age > 16
In terms of in labor force | age > 16, the demographic groups most similar to Immigrants from Ukraine are Macedonian (65.1%, a difference of 0.040%), Nicaraguan (65.1%, a difference of 0.040%), Swedish (65.1%, a difference of 0.070%), Eastern European (65.1%, a difference of 0.080%), and Immigrants from Israel (65.2%, a difference of 0.090%).
| Demographics | Rating | Rank | In Labor Force | Age > 16 |
| Immigrants | Western Asia | 67.3 /100 | #166 | Good 65.3% |
| Immigrants | Belarus | 66.0 /100 | #167 | Good 65.2% |
| Serbians | 63.5 /100 | #168 | Good 65.2% |
| Arabs | 62.4 /100 | #169 | Good 65.2% |
| Immigrants | Israel | 61.7 /100 | #170 | Good 65.2% |
| Israelis | 61.6 /100 | #171 | Good 65.2% |
| Immigrants | Sweden | 61.3 /100 | #172 | Good 65.2% |
| Immigrants | Ukraine | 53.7 /100 | #173 | Average 65.1% |
| Macedonians | 50.0 /100 | #174 | Average 65.1% |
| Nicaraguans | 49.7 /100 | #175 | Average 65.1% |
| Swedes | 47.4 /100 | #176 | Average 65.1% |
| Eastern Europeans | 46.2 /100 | #177 | Average 65.1% |
| Trinidadians and Tobagonians | 45.2 /100 | #178 | Average 65.1% |
| Immigrants | Haiti | 43.3 /100 | #179 | Average 65.1% |
| Immigrants | Latvia | 42.9 /100 | #180 | Average 65.1% |
Demographics Similar to British by In Labor Force | Age > 16
In terms of in labor force | age > 16, the demographic groups most similar to British are Chinese (64.7%, a difference of 0.0%), Immigrants from Northern Europe (64.7%, a difference of 0.0%), European (64.7%, a difference of 0.040%), Polish (64.7%, a difference of 0.040%), and Northern European (64.7%, a difference of 0.040%).
| Demographics | Rating | Rank | In Labor Force | Age > 16 |
| Hawaiians | 9.3 /100 | #222 | Tragic 64.7% |
| Immigrants | Belize | 9.2 /100 | #223 | Tragic 64.7% |
| Immigrants | Jamaica | 8.8 /100 | #224 | Tragic 64.7% |
| Croatians | 8.8 /100 | #225 | Tragic 64.7% |
| Europeans | 8.3 /100 | #226 | Tragic 64.7% |
| Poles | 8.3 /100 | #227 | Tragic 64.7% |
| Northern Europeans | 8.2 /100 | #228 | Tragic 64.7% |
| British | 7.3 /100 | #229 | Tragic 64.7% |
| Chinese | 7.3 /100 | #230 | Tragic 64.7% |
| Immigrants | Northern Europe | 7.2 /100 | #231 | Tragic 64.7% |
| Africans | 5.8 /100 | #232 | Tragic 64.6% |
| Slavs | 4.9 /100 | #233 | Tragic 64.6% |
| Vietnamese | 4.7 /100 | #234 | Tragic 64.6% |
| Austrians | 4.6 /100 | #235 | Tragic 64.6% |
| Immigrants | Norway | 4.6 /100 | #236 | Tragic 64.6% |