Immigrants from Ukraine vs Immigrants from Germany Doctorate Degree
COMPARE
Immigrants from Ukraine
Immigrants from Germany
Doctorate Degree
Doctorate Degree Comparison
Immigrants from Ukraine
Immigrants from Germany
2.0%
DOCTORATE DEGREE
90.5/ 100
METRIC RATING
130th/ 347
METRIC RANK
2.1%
DOCTORATE DEGREE
97.3/ 100
METRIC RATING
108th/ 347
METRIC RANK
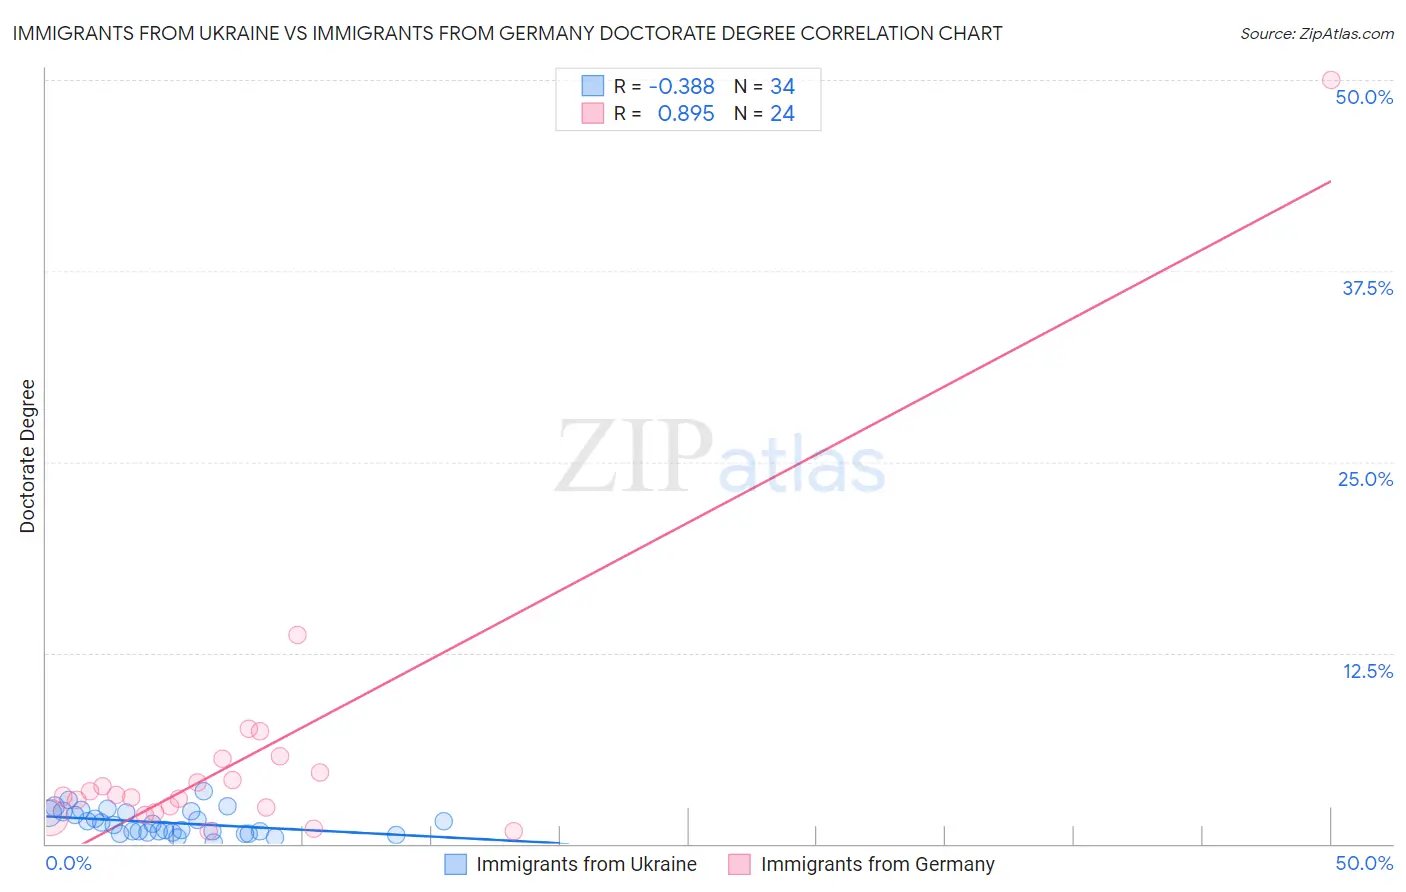
Immigrants from Ukraine vs Immigrants from Germany Doctorate Degree Correlation Chart
The statistical analysis conducted on geographies consisting of 288,420,787 people shows a mild negative correlation between the proportion of Immigrants from Ukraine and percentage of population with at least doctorate degree education in the United States with a correlation coefficient (R) of -0.388 and weighted average of 2.0%. Similarly, the statistical analysis conducted on geographies consisting of 457,324,098 people shows a very strong positive correlation between the proportion of Immigrants from Germany and percentage of population with at least doctorate degree education in the United States with a correlation coefficient (R) of 0.895 and weighted average of 2.1%, a difference of 4.5%.
Doctorate Degree Correlation Summary
| Measurement | Immigrants from Ukraine | Immigrants from Germany |
| Minimum | 0.095% | 0.81% |
| Maximum | 3.4% | 50.0% |
| Range | 3.3% | 49.2% |
| Mean | 1.4% | 5.8% |
| Median | 1.3% | 3.1% |
| Interquartile 25% (IQ1) | 0.75% | 2.2% |
| Interquartile 75% (IQ3) | 2.1% | 5.1% |
| Interquartile Range (IQR) | 1.3% | 2.9% |
| Standard Deviation (Sample) | 0.79% | 9.8% |
| Standard Deviation (Population) | 0.78% | 9.6% |
Similar Demographics by Doctorate Degree
Demographics Similar to Immigrants from Ukraine by Doctorate Degree
In terms of doctorate degree, the demographic groups most similar to Immigrants from Ukraine are Canadian (2.0%, a difference of 0.010%), Immigrants from Sierra Leone (2.0%, a difference of 0.14%), Immigrants from Zaire (2.0%, a difference of 0.22%), Scottish (2.0%, a difference of 0.41%), and Immigrants from Uzbekistan (2.0%, a difference of 0.46%).
| Demographics | Rating | Rank | Doctorate Degree |
| Croatians | 94.0 /100 | #123 | Exceptional 2.0% |
| Ute | 93.2 /100 | #124 | Exceptional 2.0% |
| Moroccans | 93.0 /100 | #125 | Exceptional 2.0% |
| Jordanians | 92.1 /100 | #126 | Exceptional 2.0% |
| Palestinians | 92.0 /100 | #127 | Exceptional 2.0% |
| Immigrants | Zaire | 91.1 /100 | #128 | Exceptional 2.0% |
| Canadians | 90.6 /100 | #129 | Exceptional 2.0% |
| Immigrants | Ukraine | 90.5 /100 | #130 | Exceptional 2.0% |
| Immigrants | Sierra Leone | 90.2 /100 | #131 | Exceptional 2.0% |
| Scottish | 89.4 /100 | #132 | Excellent 2.0% |
| Immigrants | Uzbekistan | 89.3 /100 | #133 | Excellent 2.0% |
| Immigrants | Cameroon | 88.9 /100 | #134 | Excellent 2.0% |
| Serbians | 88.7 /100 | #135 | Excellent 2.0% |
| Swedes | 88.3 /100 | #136 | Excellent 2.0% |
| South American Indians | 88.3 /100 | #137 | Excellent 2.0% |
Demographics Similar to Immigrants from Germany by Doctorate Degree
In terms of doctorate degree, the demographic groups most similar to Immigrants from Germany are Ukrainian (2.1%, a difference of 0.060%), Brazilian (2.1%, a difference of 0.13%), Immigrants from Pakistan (2.1%, a difference of 0.19%), Syrian (2.1%, a difference of 0.21%), and European (2.1%, a difference of 0.22%).
| Demographics | Rating | Rank | Doctorate Degree |
| Immigrants | Eastern Africa | 98.2 /100 | #101 | Exceptional 2.1% |
| Immigrants | Chile | 98.1 /100 | #102 | Exceptional 2.1% |
| Romanians | 98.1 /100 | #103 | Exceptional 2.1% |
| Austrians | 98.0 /100 | #104 | Exceptional 2.1% |
| Arabs | 97.8 /100 | #105 | Exceptional 2.1% |
| Sudanese | 97.7 /100 | #106 | Exceptional 2.1% |
| Europeans | 97.5 /100 | #107 | Exceptional 2.1% |
| Immigrants | Germany | 97.3 /100 | #108 | Exceptional 2.1% |
| Ukrainians | 97.2 /100 | #109 | Exceptional 2.1% |
| Brazilians | 97.2 /100 | #110 | Exceptional 2.1% |
| Immigrants | Pakistan | 97.1 /100 | #111 | Exceptional 2.1% |
| Syrians | 97.1 /100 | #112 | Exceptional 2.1% |
| Immigrants | Italy | 96.9 /100 | #113 | Exceptional 2.1% |
| Immigrants | Croatia | 96.8 /100 | #114 | Exceptional 2.1% |
| Taiwanese | 96.7 /100 | #115 | Exceptional 2.1% |