Immigrants from Turkey vs South African In Labor Force | Age 30-34

COMPARE

Immigrants from Turkey
Race
Ancestry
AfghanAfricanAlaska NativeAlaskan AthabascanAlbanianAleutAlsatianAmericanApacheArabArapahoArgentineanArmenianAssyrian/Chaldean/SyriacAustralianAustrianBahamianBangladeshiBarbadianBasqueBelgianBelizeanBermudanBhutaneseBlackfeetBolivianBrazilianBritishBritish West IndianBulgarianBurmeseCajunCambodianCanadianCape VerdeanCarpatho RusynCelticCentral AmericanCentral American IndianCherokeeCheyenneChickasawChileanChineseChippewaChoctawColombianColvilleComancheCosta RicanCreeCreekCroatianCrowCubanCypriotCzechCzechoslovakianDanishDelawareDominicanDutchDutch West IndianEastern EuropeanEcuadorianEgyptianEnglishEstonianEthiopianEuropeanFijianFilipinoFinnishFrenchFrench American IndianFrench CanadianGermanGerman RussianGhanaianGreekGuamanian/ChamorroGuatemalanGuyaneseHaitianHmongHonduranHopiHoumaHungarianIcelanderIndian (Asian)IndonesianInupiatIranianIraqiIrishIroquoisIsraeliItalianJamaicanJapaneseJordanianKenyanKiowaKoreanLaotianLatvianLebaneseLiberianLithuanianLumbeeLuxembourgerMacedonianMalaysianMalteseMarshalleseMenomineeMexicanMexican American IndianMongolianMoroccanNative HawaiianNavajoNepaleseNew ZealanderNicaraguanNigerianNorthern EuropeanNorwegianOkinawanOsageOttawaPaiutePakistaniPalestinianPanamanianParaguayanPennsylvania GermanPeruvianPimaPolishPortuguesePotawatomiPuebloPuerto RicanPuget Sound SalishRomanianRussianSalvadoranSamoanScandinavianScotch-IrishScottishSeminoleSenegaleseSerbianShoshoneSierra LeoneanSiouxSlavicSlovakSloveneSomaliSouth AmericanSouth American IndianSoviet UnionSpaniardSpanishSpanish AmericanSpanish American IndianSri LankanSubsaharan AfricanSudaneseSwedishSwissSyrianTaiwaneseThaiTlingit-HaidaTohono O'OdhamTonganTrinidadian and TobagonianTsimshianTurkishU.S. Virgin IslanderUgandanUkrainianUruguayanUteVenezuelanVietnameseWelshWest IndianYakamaYaquiYugoslavianYumanYup'ikZimbabwean
Immigration
NonimmigrantsImmigrantsAfghanistanAfricaAlbaniaArgentinaArmeniaAsiaAustraliaAustriaBahamasBangladeshBarbadosBelarusBelgiumBelizeBoliviaBosnia and HerzegovinaBrazilBulgariaBurma/MyanmarCabo VerdeCambodiaCameroonCanadaCaribbeanCentral AmericaChileChinaColombiaCongoCosta RicaCroatiaCubaCzechoslovakiaDenmarkDominicaDominican RepublicEastern AfricaEastern AsiaEastern EuropeEcuadorEgyptEl SalvadorEnglandEritreaEthiopiaEuropeFijiFranceGermanyGhanaGreeceGrenadaGuatemalaGuyanaHaitiHondurasHong KongHungaryIndiaIndonesiaIranIraqIrelandIsraelItalyJamaicaJapanJordanKazakhstanKenyaKoreaKuwaitLaosLatin AmericaLatviaLebanonLiberiaLithuaniaMalaysiaMexicoMicronesiaMiddle AfricaMoldovaMoroccoNepalNetherlandsNicaraguaNigeriaNorth AmericaNorth MacedoniaNorthern AfricaNorthern EuropeNorwayOceaniaPakistanPanamaPeruPhilippinesPolandPortugalRomaniaRussiaSaudi ArabiaScotlandSenegalSerbiaSierra LeoneSingaporeSomaliaSouth AfricaSouth AmericaSouth Central AsiaSouth Eastern AsiaSouthern EuropeSpainSri LankaSt. Vincent and the GrenadinesSudanSwedenSwitzerlandSyriaTaiwanThailandTrinidad and TobagoTurkeyUgandaUkraineUruguayUzbekistanVenezuelaVietnamWest IndiesWestern AfricaWestern AsiaWestern EuropeYemenZaireZimbabweAzores
South African
Race
Ancestry
AfghanAfricanAlaska NativeAlaskan AthabascanAlbanianAleutAlsatianAmericanApacheArabArapahoArgentineanArmenianAssyrian/Chaldean/SyriacAustralianAustrianBahamianBangladeshiBarbadianBasqueBelgianBelizeanBermudanBhutaneseBlackfeetBolivianBrazilianBritishBritish West IndianBulgarianBurmeseCajunCambodianCanadianCape VerdeanCarpatho RusynCelticCentral AmericanCentral American IndianCherokeeCheyenneChickasawChileanChineseChippewaChoctawColombianColvilleComancheCosta RicanCreeCreekCroatianCrowCubanCypriotCzechCzechoslovakianDanishDelawareDominicanDutchDutch West IndianEastern EuropeanEcuadorianEgyptianEnglishEstonianEthiopianEuropeanFijianFilipinoFinnishFrenchFrench American IndianFrench CanadianGermanGerman RussianGhanaianGreekGuamanian/ChamorroGuatemalanGuyaneseHaitianHmongHonduranHopiHoumaHungarianIcelanderIndian (Asian)IndonesianInupiatIranianIraqiIrishIroquoisIsraeliItalianJamaicanJapaneseJordanianKenyanKiowaKoreanLaotianLatvianLebaneseLiberianLithuanianLumbeeLuxembourgerMacedonianMalaysianMalteseMarshalleseMenomineeMexicanMexican American IndianMongolianMoroccanNative HawaiianNavajoNepaleseNew ZealanderNicaraguanNigerianNorthern EuropeanNorwegianOkinawanOsageOttawaPaiutePakistaniPalestinianPanamanianParaguayanPennsylvania GermanPeruvianPimaPolishPortuguesePotawatomiPuebloPuerto RicanPuget Sound SalishRomanianRussianSalvadoranSamoanScandinavianScotch-IrishScottishSeminoleSenegaleseSerbianShoshoneSierra LeoneanSiouxSlavicSlovakSloveneSomaliSouth AfricanSouth AmericanSouth American IndianSoviet UnionSpaniardSpanishSpanish AmericanSpanish American IndianSri LankanSubsaharan AfricanSudaneseSwedishSwissSyrianTaiwaneseThaiTlingit-HaidaTohono O'OdhamTonganTrinidadian and TobagonianTsimshianTurkishU.S. Virgin IslanderUgandanUkrainianUruguayanUteVenezuelanVietnameseWelshWest IndianYakamaYaquiYugoslavianYumanYup'ikZimbabwean
Immigration
NonimmigrantsImmigrantsAfghanistanAfricaAlbaniaArgentinaArmeniaAsiaAustraliaAustriaBahamasBangladeshBarbadosBelarusBelgiumBelizeBoliviaBosnia and HerzegovinaBrazilBulgariaBurma/MyanmarCabo VerdeCambodiaCameroonCanadaCaribbeanCentral AmericaChileChinaColombiaCongoCosta RicaCroatiaCubaCzechoslovakiaDenmarkDominicaDominican RepublicEastern AfricaEastern AsiaEastern EuropeEcuadorEgyptEl SalvadorEnglandEritreaEthiopiaEuropeFijiFranceGermanyGhanaGreeceGrenadaGuatemalaGuyanaHaitiHondurasHong KongHungaryIndiaIndonesiaIranIraqIrelandIsraelItalyJamaicaJapanJordanKazakhstanKenyaKoreaKuwaitLaosLatin AmericaLatviaLebanonLiberiaLithuaniaMalaysiaMexicoMicronesiaMiddle AfricaMoldovaMoroccoNepalNetherlandsNicaraguaNigeriaNorth AmericaNorth MacedoniaNorthern AfricaNorthern EuropeNorwayOceaniaPakistanPanamaPeruPhilippinesPolandPortugalRomaniaRussiaSaudi ArabiaScotlandSenegalSerbiaSierra LeoneSingaporeSomaliaSouth AfricaSouth AmericaSouth Central AsiaSouth Eastern AsiaSouthern EuropeSpainSri LankaSt. Vincent and the GrenadinesSudanSwedenSwitzerlandSyriaTaiwanThailandTrinidad and TobagoUgandaUkraineUruguayUzbekistanVenezuelaVietnamWest IndiesWestern AfricaWestern AsiaWestern EuropeYemenZaireZimbabweAzores
In Labor Force | Age 30-34
Income
Poverty
Unemployment
Labor Participation
Family Structure
Vehicle Availability
Education Level
Disability

In Labor Force | Age 30-34 Comparison

Immigrants from Turkey

South Africans

Exceptional
Excellent
85.5%
IN LABOR FORCE | AGE 30-34
99.6/ 100
METRIC RATING
55th/ 347
METRIC RANK
85.0%
IN LABOR FORCE | AGE 30-34
88.0/ 100
METRIC RATING
137th/ 347
METRIC RANK

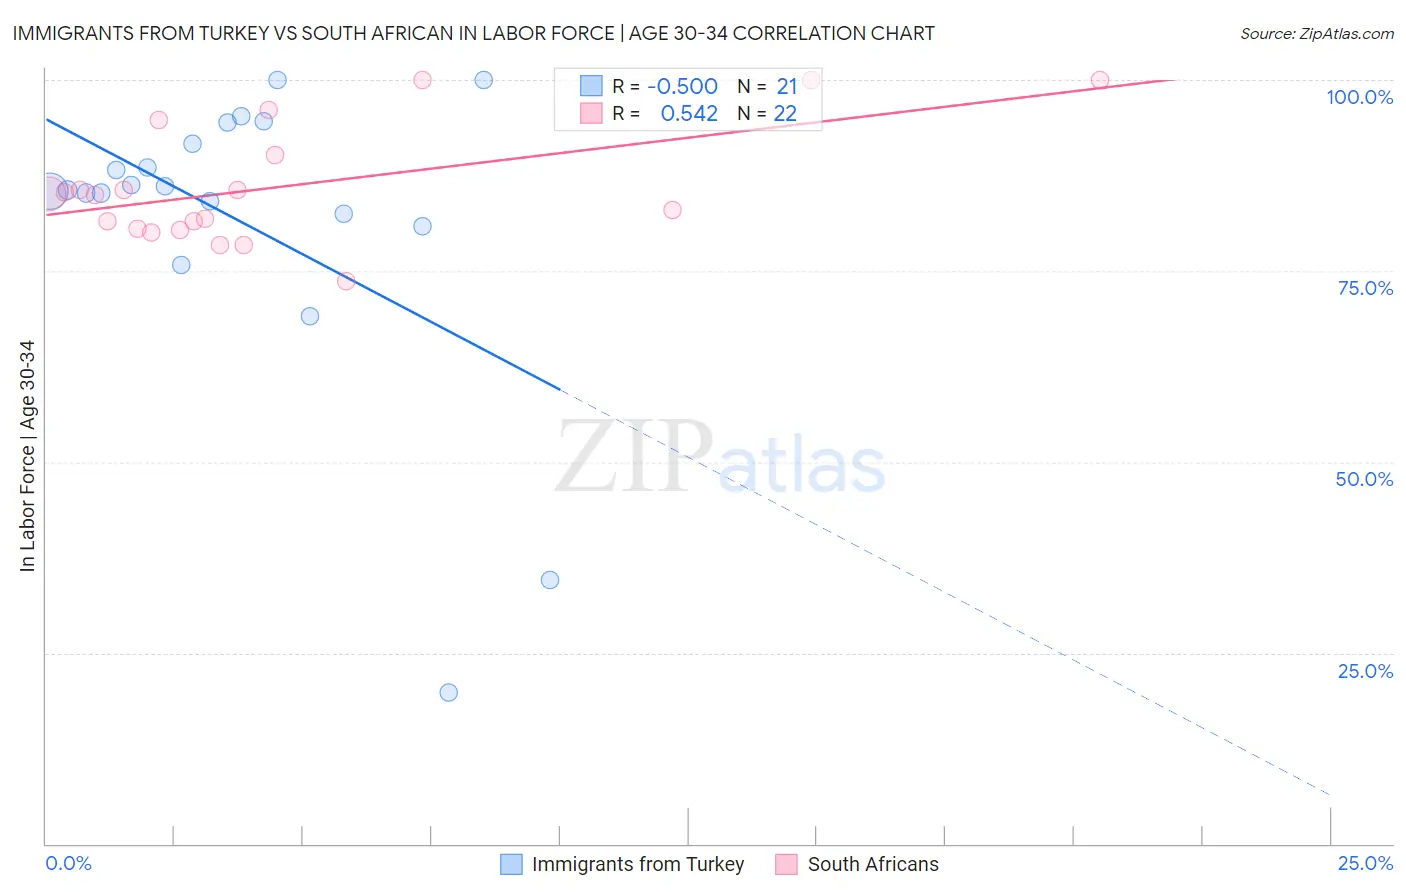
Immigrants from Turkey vs South African In Labor Force | Age 30-34 Correlation Chart

The statistical analysis conducted on geographies consisting of 222,992,305 people shows a moderate negative correlation between the proportion of Immigrants from Turkey and labor force participation rate among population between the ages 30 and 34 in the United States with a correlation coefficient (R) of -0.500 and weighted average of 85.5%. Similarly, the statistical analysis conducted on geographies consisting of 182,546,493 people shows a substantial positive correlation between the proportion of South Africans and labor force participation rate among population between the ages 30 and 34 in the United States with a correlation coefficient (R) of 0.542 and weighted average of 85.0%, a difference of 0.62%.
Immigrants from Turkey vs South African In Labor Force | Age 30-34

In Labor Force | Age 30-34 Correlation Summary

MeasurementImmigrants from TurkeySouth African
Minimum19.8%73.6%
Maximum100.0%100.0%
Range80.2%26.4%
Mean81.6%86.0%
Median85.6%85.0%
Interquartile 25% (IQ1)81.7%80.5%
Interquartile 75% (IQ3)93.0%90.1%
Interquartile Range (IQR)11.3%9.6%
Standard Deviation (Sample)19.7%7.6%
Standard Deviation (Population)19.2%7.4%

Similar Demographics by In Labor Force | Age 30-34

Demographics Similar to Immigrants from Turkey by In Labor Force | Age 30-34

In terms of in labor force | age 30-34, the demographic groups most similar to Immigrants from Turkey are Immigrants from Kenya (85.5%, a difference of 0.0%), Czech (85.5%, a difference of 0.010%), Russian (85.5%, a difference of 0.010%), Polish (85.5%, a difference of 0.010%), and Filipino (85.5%, a difference of 0.020%).
DemographicsRating | RankIn Labor Force | Age 30-34
Immigrants | Sweden
99.8
/100
|
#48
Exceptional
85.6%
Lithuanians
99.8
/100
|
#49
Exceptional
85.6%
Immigrants | Australia
99.8
/100
|
#50
Exceptional
85.6%
Cape Verdeans
99.7
/100
|
#51
Exceptional
85.6%
Slovenes
99.7
/100
|
#52
Exceptional
85.6%
Filipinos
99.6
/100
|
#53
Exceptional
85.5%
Immigrants | Kenya
99.6
/100
|
#54
Exceptional
85.5%
Immigrants | Turkey
99.6
/100
|
#55
Exceptional
85.5%
Czechs
99.6
/100
|
#56
Exceptional
85.5%
Russians
99.6
/100
|
#57
Exceptional
85.5%
Poles
99.6
/100
|
#58
Exceptional
85.5%
Immigrants | Poland
99.5
/100
|
#59
Exceptional
85.5%
Immigrants | France
99.5
/100
|
#60
Exceptional
85.5%
Immigrants | Brazil
99.5
/100
|
#61
Exceptional
85.5%
Soviet Union
99.4
/100
|
#62
Exceptional
85.5%

Demographics Similar to South Africans by In Labor Force | Age 30-34

In terms of in labor force | age 30-34, the demographic groups most similar to South Africans are Sri Lankan (85.0%, a difference of 0.0%), Jordanian (85.0%, a difference of 0.010%), Bhutanese (85.0%, a difference of 0.010%), Immigrants from Chile (85.0%, a difference of 0.020%), and Immigrants from Asia (85.0%, a difference of 0.020%).
DemographicsRating | RankIn Labor Force | Age 30-34
Immigrants | Spain
90.0
/100
|
#130
Exceptional
85.0%
Chinese
89.6
/100
|
#131
Excellent
85.0%
Immigrants | Israel
89.5
/100
|
#132
Excellent
85.0%
New Zealanders
89.5
/100
|
#133
Excellent
85.0%
Immigrants | Chile
89.2
/100
|
#134
Excellent
85.0%
Immigrants | Asia
88.9
/100
|
#135
Excellent
85.0%
Jordanians
88.6
/100
|
#136
Excellent
85.0%
South Africans
88.0
/100
|
#137
Excellent
85.0%
Sri Lankans
87.8
/100
|
#138
Excellent
85.0%
Bhutanese
87.5
/100
|
#139
Excellent
85.0%
Immigrants | Vietnam
86.5
/100
|
#140
Excellent
85.0%
Chileans
85.3
/100
|
#141
Excellent
84.9%
Immigrants | Indonesia
84.3
/100
|
#142
Excellent
84.9%
Colombians
82.2
/100
|
#143
Excellent
84.9%
Uruguayans
78.5
/100
|
#144
Good
84.9%