Immigrants from Turkey vs Immigrants from Western Asia In Labor Force | Age 30-34
COMPARE
Immigrants from Turkey
Immigrants from Western Asia
In Labor Force | Age 30-34
In Labor Force | Age 30-34 Comparison
Immigrants from Turkey
Immigrants from Western Asia
85.5%
IN LABOR FORCE | AGE 30-34
99.6/ 100
METRIC RATING
55th/ 347
METRIC RANK
84.3%
IN LABOR FORCE | AGE 30-34
8.2/ 100
METRIC RATING
212th/ 347
METRIC RANK
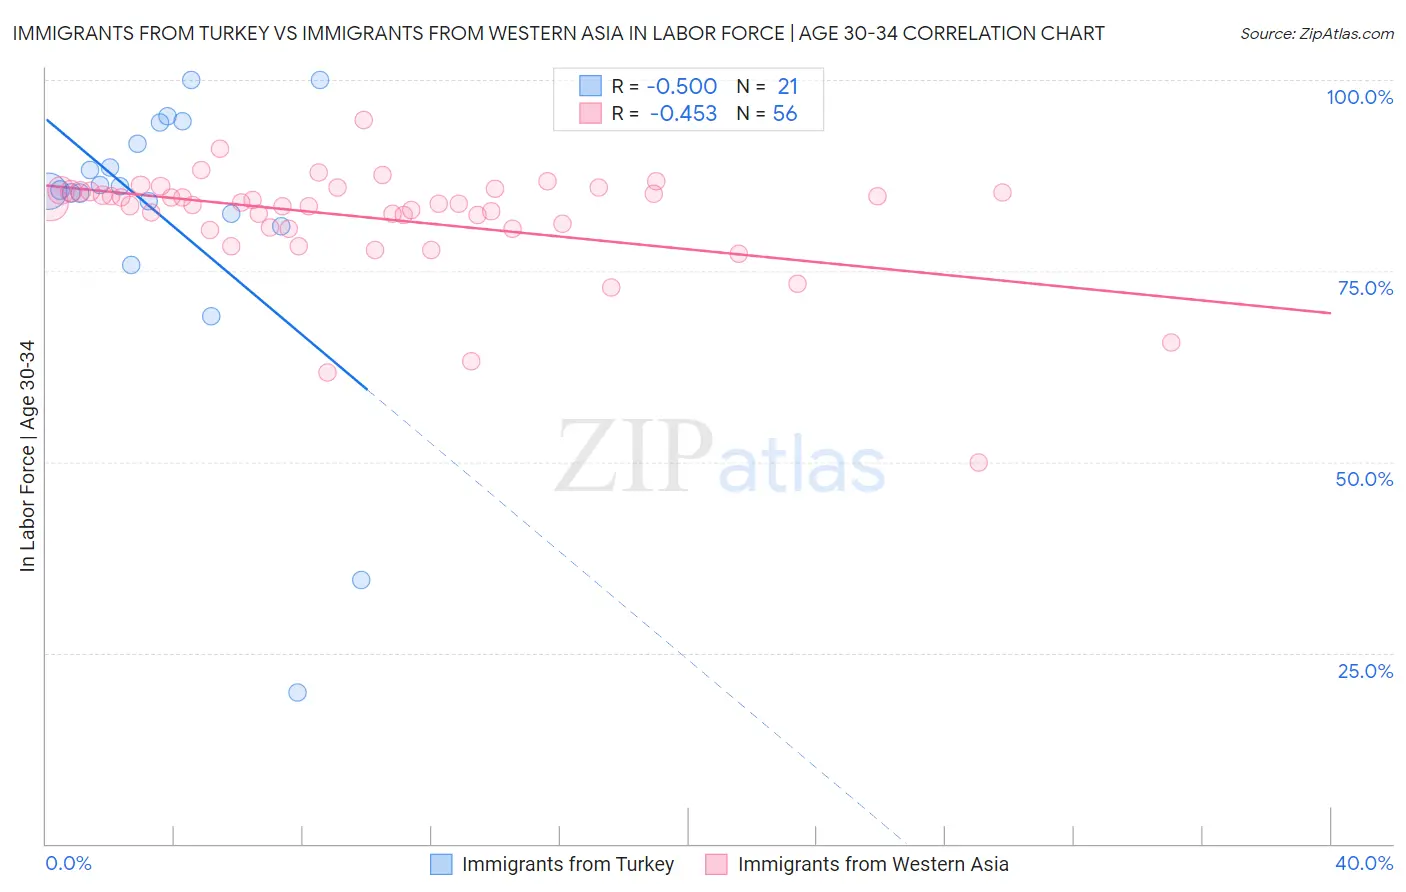
Immigrants from Turkey vs Immigrants from Western Asia In Labor Force | Age 30-34 Correlation Chart
The statistical analysis conducted on geographies consisting of 222,992,305 people shows a moderate negative correlation between the proportion of Immigrants from Turkey and labor force participation rate among population between the ages 30 and 34 in the United States with a correlation coefficient (R) of -0.500 and weighted average of 85.5%. Similarly, the statistical analysis conducted on geographies consisting of 404,180,460 people shows a moderate negative correlation between the proportion of Immigrants from Western Asia and labor force participation rate among population between the ages 30 and 34 in the United States with a correlation coefficient (R) of -0.453 and weighted average of 84.3%, a difference of 1.4%.
In Labor Force | Age 30-34 Correlation Summary
| Measurement | Immigrants from Turkey | Immigrants from Western Asia |
| Minimum | 19.8% | 50.0% |
| Maximum | 100.0% | 94.8% |
| Range | 80.2% | 44.8% |
| Mean | 81.6% | 81.9% |
| Median | 85.6% | 83.8% |
| Interquartile 25% (IQ1) | 81.7% | 80.6% |
| Interquartile 75% (IQ3) | 93.0% | 85.4% |
| Interquartile Range (IQR) | 11.3% | 4.8% |
| Standard Deviation (Sample) | 19.7% | 7.3% |
| Standard Deviation (Population) | 19.2% | 7.2% |
Similar Demographics by In Labor Force | Age 30-34
Demographics Similar to Immigrants from Turkey by In Labor Force | Age 30-34
In terms of in labor force | age 30-34, the demographic groups most similar to Immigrants from Turkey are Immigrants from Kenya (85.5%, a difference of 0.0%), Czech (85.5%, a difference of 0.010%), Russian (85.5%, a difference of 0.010%), Polish (85.5%, a difference of 0.010%), and Filipino (85.5%, a difference of 0.020%).
| Demographics | Rating | Rank | In Labor Force | Age 30-34 |
| Immigrants | Sweden | 99.8 /100 | #48 | Exceptional 85.6% |
| Lithuanians | 99.8 /100 | #49 | Exceptional 85.6% |
| Immigrants | Australia | 99.8 /100 | #50 | Exceptional 85.6% |
| Cape Verdeans | 99.7 /100 | #51 | Exceptional 85.6% |
| Slovenes | 99.7 /100 | #52 | Exceptional 85.6% |
| Filipinos | 99.6 /100 | #53 | Exceptional 85.5% |
| Immigrants | Kenya | 99.6 /100 | #54 | Exceptional 85.5% |
| Immigrants | Turkey | 99.6 /100 | #55 | Exceptional 85.5% |
| Czechs | 99.6 /100 | #56 | Exceptional 85.5% |
| Russians | 99.6 /100 | #57 | Exceptional 85.5% |
| Poles | 99.6 /100 | #58 | Exceptional 85.5% |
| Immigrants | Poland | 99.5 /100 | #59 | Exceptional 85.5% |
| Immigrants | France | 99.5 /100 | #60 | Exceptional 85.5% |
| Immigrants | Brazil | 99.5 /100 | #61 | Exceptional 85.5% |
| Soviet Union | 99.4 /100 | #62 | Exceptional 85.5% |
Demographics Similar to Immigrants from Western Asia by In Labor Force | Age 30-34
In terms of in labor force | age 30-34, the demographic groups most similar to Immigrants from Western Asia are Arab (84.3%, a difference of 0.010%), Jamaican (84.3%, a difference of 0.010%), Indonesian (84.3%, a difference of 0.010%), Japanese (84.3%, a difference of 0.010%), and Immigrants from Jamaica (84.3%, a difference of 0.010%).
| Demographics | Rating | Rank | In Labor Force | Age 30-34 |
| French | 13.8 /100 | #205 | Poor 84.4% |
| Lebanese | 10.6 /100 | #206 | Poor 84.4% |
| Bangladeshis | 9.4 /100 | #207 | Tragic 84.3% |
| Arabs | 8.9 /100 | #208 | Tragic 84.3% |
| Jamaicans | 8.8 /100 | #209 | Tragic 84.3% |
| Indonesians | 8.8 /100 | #210 | Tragic 84.3% |
| Japanese | 8.8 /100 | #211 | Tragic 84.3% |
| Immigrants | Western Asia | 8.2 /100 | #212 | Tragic 84.3% |
| Immigrants | Jamaica | 7.9 /100 | #213 | Tragic 84.3% |
| Immigrants | Germany | 7.2 /100 | #214 | Tragic 84.3% |
| Europeans | 7.2 /100 | #215 | Tragic 84.3% |
| Immigrants | Ecuador | 7.1 /100 | #216 | Tragic 84.3% |
| Immigrants | Trinidad and Tobago | 7.0 /100 | #217 | Tragic 84.3% |
| Immigrants | Panama | 6.3 /100 | #218 | Tragic 84.3% |
| Swiss | 5.8 /100 | #219 | Tragic 84.3% |