Immigrants from Turkey vs Crow In Labor Force | Age 20-24
COMPARE
Immigrants from Turkey
Crow
In Labor Force | Age 20-24
In Labor Force | Age 20-24 Comparison
Immigrants from Turkey
Crow
73.7%
IN LABOR FORCE | AGE 20-24
0.7/ 100
METRIC RATING
260th/ 347
METRIC RANK
76.9%
IN LABOR FORCE | AGE 20-24
99.9/ 100
METRIC RATING
65th/ 347
METRIC RANK
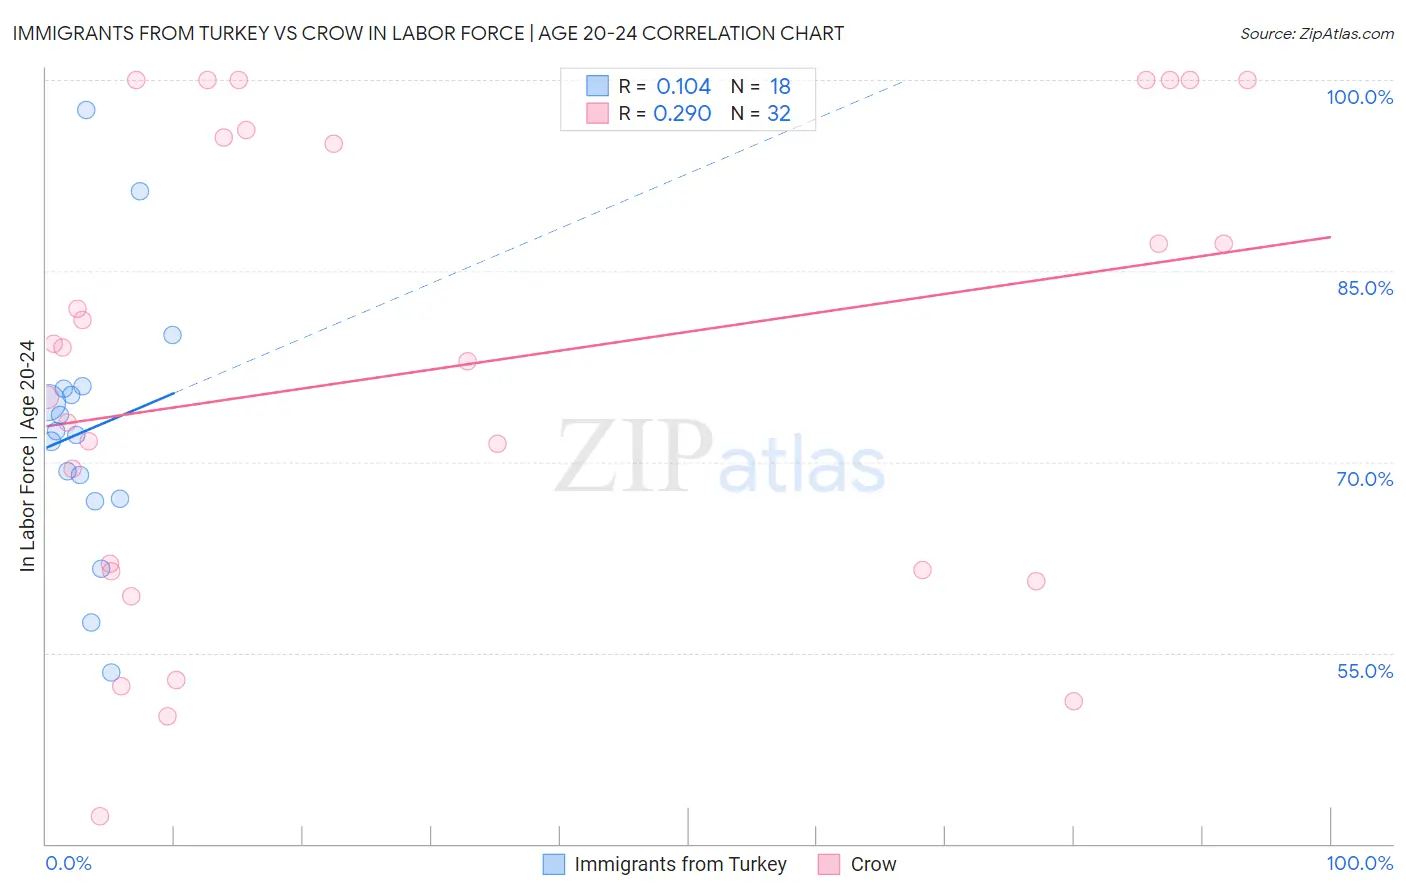
Immigrants from Turkey vs Crow In Labor Force | Age 20-24 Correlation Chart
The statistical analysis conducted on geographies consisting of 223,027,856 people shows a poor positive correlation between the proportion of Immigrants from Turkey and labor force participation rate among population between the ages 20 and 24 in the United States with a correlation coefficient (R) of 0.104 and weighted average of 73.7%. Similarly, the statistical analysis conducted on geographies consisting of 59,196,600 people shows a weak positive correlation between the proportion of Crow and labor force participation rate among population between the ages 20 and 24 in the United States with a correlation coefficient (R) of 0.290 and weighted average of 76.9%, a difference of 4.4%.
In Labor Force | Age 20-24 Correlation Summary
| Measurement | Immigrants from Turkey | Crow |
| Minimum | 53.5% | 42.2% |
| Maximum | 97.7% | 100.0% |
| Range | 44.2% | 57.8% |
| Mean | 72.5% | 77.3% |
| Median | 72.2% | 78.5% |
| Interquartile 25% (IQ1) | 67.1% | 61.5% |
| Interquartile 75% (IQ3) | 75.7% | 95.8% |
| Interquartile Range (IQR) | 8.6% | 34.3% |
| Standard Deviation (Sample) | 10.5% | 18.1% |
| Standard Deviation (Population) | 10.2% | 17.9% |
Similar Demographics by In Labor Force | Age 20-24
Demographics Similar to Immigrants from Turkey by In Labor Force | Age 20-24
In terms of in labor force | age 20-24, the demographic groups most similar to Immigrants from Turkey are Houma (73.7%, a difference of 0.010%), Asian (73.7%, a difference of 0.020%), Egyptian (73.7%, a difference of 0.030%), Dutch West Indian (73.7%, a difference of 0.030%), and Paraguayan (73.7%, a difference of 0.070%).
| Demographics | Rating | Rank | In Labor Force | Age 20-24 |
| Arapaho | 1.0 /100 | #253 | Tragic 73.8% |
| Ute | 1.0 /100 | #254 | Tragic 73.8% |
| Immigrants | Pakistan | 0.9 /100 | #255 | Tragic 73.8% |
| Spanish American Indians | 0.8 /100 | #256 | Tragic 73.7% |
| Paraguayans | 0.8 /100 | #257 | Tragic 73.7% |
| Egyptians | 0.7 /100 | #258 | Tragic 73.7% |
| Dutch West Indians | 0.7 /100 | #259 | Tragic 73.7% |
| Immigrants | Turkey | 0.7 /100 | #260 | Tragic 73.7% |
| Houma | 0.6 /100 | #261 | Tragic 73.7% |
| Asians | 0.6 /100 | #262 | Tragic 73.7% |
| Immigrants | Asia | 0.5 /100 | #263 | Tragic 73.6% |
| Immigrants | Haiti | 0.5 /100 | #264 | Tragic 73.6% |
| Burmese | 0.5 /100 | #265 | Tragic 73.6% |
| Haitians | 0.5 /100 | #266 | Tragic 73.6% |
| Immigrants | Western Asia | 0.4 /100 | #267 | Tragic 73.5% |
Demographics Similar to Crow by In Labor Force | Age 20-24
In terms of in labor force | age 20-24, the demographic groups most similar to Crow are Icelander (76.9%, a difference of 0.020%), Slavic (76.9%, a difference of 0.020%), White/Caucasian (76.9%, a difference of 0.050%), French American Indian (76.8%, a difference of 0.060%), and Immigrants from Sudan (76.8%, a difference of 0.080%).
| Demographics | Rating | Rank | In Labor Force | Age 20-24 |
| Hawaiians | 99.9 /100 | #58 | Exceptional 77.0% |
| Scotch-Irish | 99.9 /100 | #59 | Exceptional 77.0% |
| Kenyans | 99.9 /100 | #60 | Exceptional 77.0% |
| Immigrants | Eritrea | 99.9 /100 | #61 | Exceptional 77.0% |
| Immigrants | Kenya | 99.9 /100 | #62 | Exceptional 77.0% |
| Lithuanians | 99.9 /100 | #63 | Exceptional 77.0% |
| Whites/Caucasians | 99.9 /100 | #64 | Exceptional 76.9% |
| Crow | 99.9 /100 | #65 | Exceptional 76.9% |
| Icelanders | 99.9 /100 | #66 | Exceptional 76.9% |
| Slavs | 99.9 /100 | #67 | Exceptional 76.9% |
| French American Indians | 99.8 /100 | #68 | Exceptional 76.8% |
| Immigrants | Sudan | 99.8 /100 | #69 | Exceptional 76.8% |
| Ottawa | 99.8 /100 | #70 | Exceptional 76.8% |
| Northern Europeans | 99.8 /100 | #71 | Exceptional 76.8% |
| Guamanians/Chamorros | 99.8 /100 | #72 | Exceptional 76.7% |