Immigrants from Ireland vs Crow In Labor Force | Age 20-24
COMPARE
Immigrants from Ireland
Crow
In Labor Force | Age 20-24
In Labor Force | Age 20-24 Comparison
Immigrants from Ireland
Crow
74.3%
IN LABOR FORCE | AGE 20-24
5.8/ 100
METRIC RATING
227th/ 347
METRIC RANK
76.9%
IN LABOR FORCE | AGE 20-24
99.9/ 100
METRIC RATING
65th/ 347
METRIC RANK
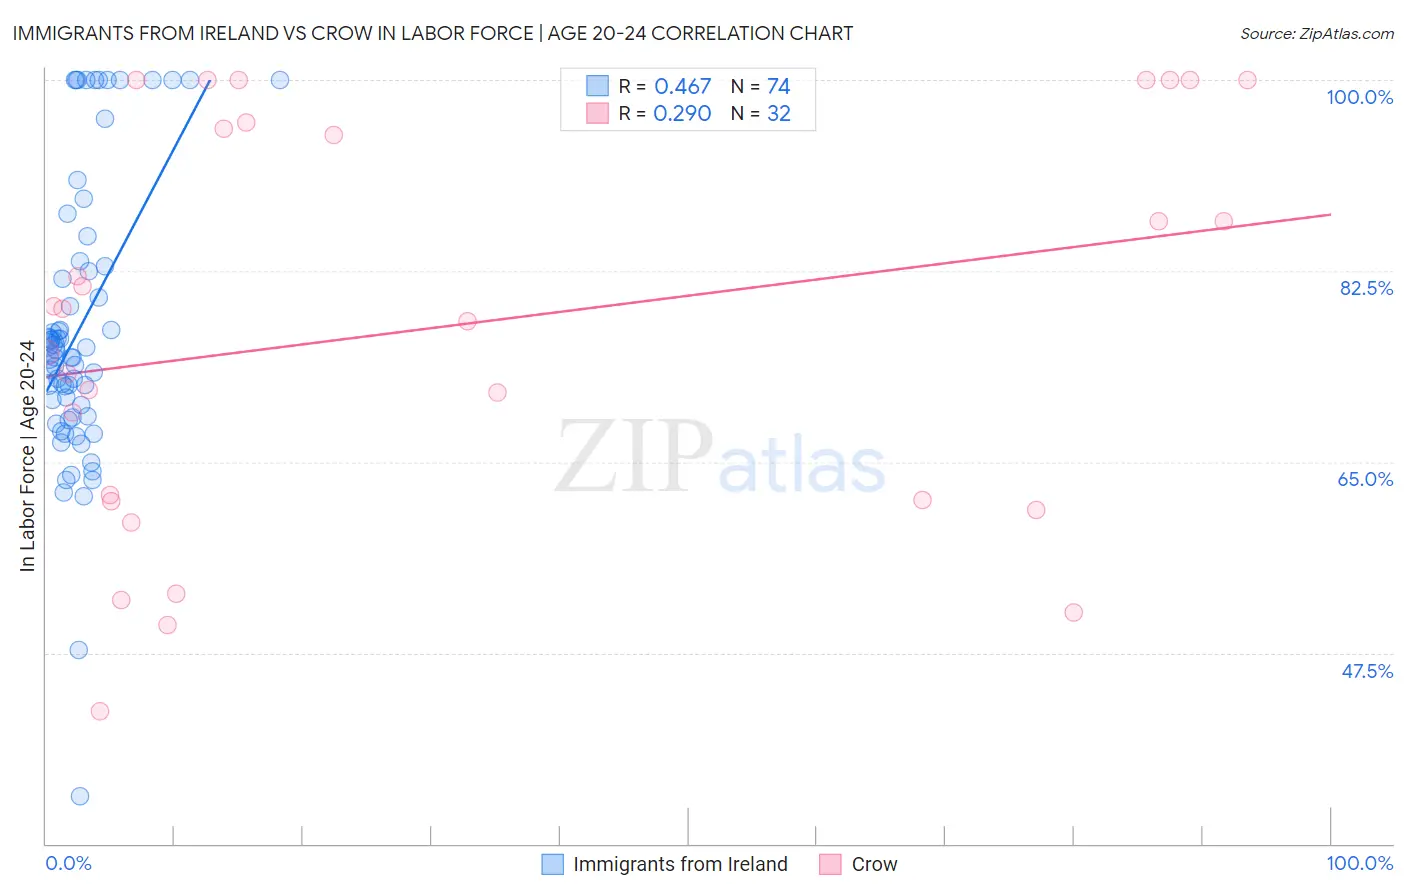
Immigrants from Ireland vs Crow In Labor Force | Age 20-24 Correlation Chart
The statistical analysis conducted on geographies consisting of 240,706,674 people shows a moderate positive correlation between the proportion of Immigrants from Ireland and labor force participation rate among population between the ages 20 and 24 in the United States with a correlation coefficient (R) of 0.467 and weighted average of 74.3%. Similarly, the statistical analysis conducted on geographies consisting of 59,196,600 people shows a weak positive correlation between the proportion of Crow and labor force participation rate among population between the ages 20 and 24 in the United States with a correlation coefficient (R) of 0.290 and weighted average of 76.9%, a difference of 3.5%.
In Labor Force | Age 20-24 Correlation Summary
| Measurement | Immigrants from Ireland | Crow |
| Minimum | 34.3% | 42.2% |
| Maximum | 100.0% | 100.0% |
| Range | 65.7% | 57.8% |
| Mean | 77.3% | 77.3% |
| Median | 74.9% | 78.5% |
| Interquartile 25% (IQ1) | 69.2% | 61.5% |
| Interquartile 75% (IQ3) | 82.9% | 95.8% |
| Interquartile Range (IQR) | 13.7% | 34.3% |
| Standard Deviation (Sample) | 13.1% | 18.1% |
| Standard Deviation (Population) | 13.0% | 17.9% |
Similar Demographics by In Labor Force | Age 20-24
Demographics Similar to Immigrants from Ireland by In Labor Force | Age 20-24
In terms of in labor force | age 20-24, the demographic groups most similar to Immigrants from Ireland are Immigrants from Fiji (74.3%, a difference of 0.010%), Ghanaian (74.3%, a difference of 0.030%), Immigrants from Ukraine (74.2%, a difference of 0.050%), Seminole (74.3%, a difference of 0.070%), and Immigrants from Sweden (74.2%, a difference of 0.090%).
| Demographics | Rating | Rank | In Labor Force | Age 20-24 |
| Immigrants | Norway | 10.3 /100 | #220 | Poor 74.5% |
| Chickasaw | 10.3 /100 | #221 | Poor 74.5% |
| Immigrants | India | 9.9 /100 | #222 | Tragic 74.4% |
| Hispanics or Latinos | 7.9 /100 | #223 | Tragic 74.4% |
| Seminole | 6.9 /100 | #224 | Tragic 74.3% |
| Ghanaians | 6.2 /100 | #225 | Tragic 74.3% |
| Immigrants | Fiji | 5.9 /100 | #226 | Tragic 74.3% |
| Immigrants | Ireland | 5.8 /100 | #227 | Tragic 74.3% |
| Immigrants | Ukraine | 5.1 /100 | #228 | Tragic 74.2% |
| Immigrants | Sweden | 4.6 /100 | #229 | Tragic 74.2% |
| Immigrants | Albania | 4.3 /100 | #230 | Tragic 74.2% |
| Immigrants | Greece | 4.1 /100 | #231 | Tragic 74.2% |
| Immigrants | Switzerland | 4.1 /100 | #232 | Tragic 74.2% |
| Immigrants | Chile | 3.7 /100 | #233 | Tragic 74.1% |
| Immigrants | Immigrants | 3.6 /100 | #234 | Tragic 74.1% |
Demographics Similar to Crow by In Labor Force | Age 20-24
In terms of in labor force | age 20-24, the demographic groups most similar to Crow are Icelander (76.9%, a difference of 0.020%), Slavic (76.9%, a difference of 0.020%), White/Caucasian (76.9%, a difference of 0.050%), French American Indian (76.8%, a difference of 0.060%), and Immigrants from Sudan (76.8%, a difference of 0.080%).
| Demographics | Rating | Rank | In Labor Force | Age 20-24 |
| Hawaiians | 99.9 /100 | #58 | Exceptional 77.0% |
| Scotch-Irish | 99.9 /100 | #59 | Exceptional 77.0% |
| Kenyans | 99.9 /100 | #60 | Exceptional 77.0% |
| Immigrants | Eritrea | 99.9 /100 | #61 | Exceptional 77.0% |
| Immigrants | Kenya | 99.9 /100 | #62 | Exceptional 77.0% |
| Lithuanians | 99.9 /100 | #63 | Exceptional 77.0% |
| Whites/Caucasians | 99.9 /100 | #64 | Exceptional 76.9% |
| Crow | 99.9 /100 | #65 | Exceptional 76.9% |
| Icelanders | 99.9 /100 | #66 | Exceptional 76.9% |
| Slavs | 99.9 /100 | #67 | Exceptional 76.9% |
| French American Indians | 99.8 /100 | #68 | Exceptional 76.8% |
| Immigrants | Sudan | 99.8 /100 | #69 | Exceptional 76.8% |
| Ottawa | 99.8 /100 | #70 | Exceptional 76.8% |
| Northern Europeans | 99.8 /100 | #71 | Exceptional 76.8% |
| Guamanians/Chamorros | 99.8 /100 | #72 | Exceptional 76.7% |