Bulgarian vs Crow In Labor Force | Age 20-24
COMPARE
Bulgarian
Crow
In Labor Force | Age 20-24
In Labor Force | Age 20-24 Comparison
Bulgarians
Crow
76.4%
IN LABOR FORCE | AGE 20-24
99.2/ 100
METRIC RATING
89th/ 347
METRIC RANK
76.9%
IN LABOR FORCE | AGE 20-24
99.9/ 100
METRIC RATING
65th/ 347
METRIC RANK
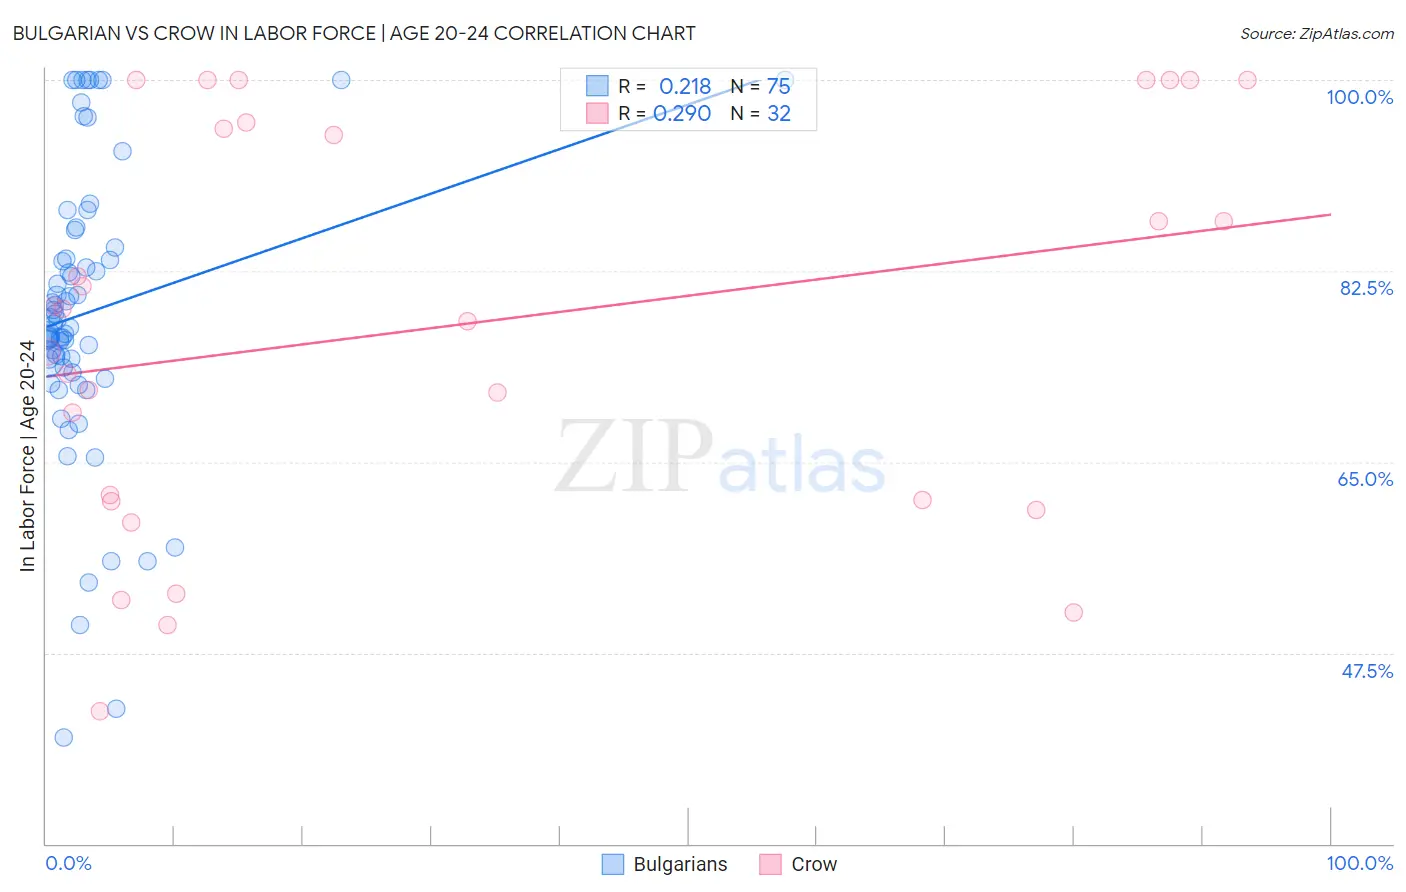
Bulgarian vs Crow In Labor Force | Age 20-24 Correlation Chart
The statistical analysis conducted on geographies consisting of 205,574,521 people shows a weak positive correlation between the proportion of Bulgarians and labor force participation rate among population between the ages 20 and 24 in the United States with a correlation coefficient (R) of 0.218 and weighted average of 76.4%. Similarly, the statistical analysis conducted on geographies consisting of 59,196,600 people shows a weak positive correlation between the proportion of Crow and labor force participation rate among population between the ages 20 and 24 in the United States with a correlation coefficient (R) of 0.290 and weighted average of 76.9%, a difference of 0.67%.
In Labor Force | Age 20-24 Correlation Summary
| Measurement | Bulgarian | Crow |
| Minimum | 39.8% | 42.2% |
| Maximum | 100.0% | 100.0% |
| Range | 60.2% | 57.8% |
| Mean | 78.7% | 77.3% |
| Median | 77.7% | 78.5% |
| Interquartile 25% (IQ1) | 73.6% | 61.5% |
| Interquartile 75% (IQ3) | 84.6% | 95.8% |
| Interquartile Range (IQR) | 11.0% | 34.3% |
| Standard Deviation (Sample) | 13.1% | 18.1% |
| Standard Deviation (Population) | 13.0% | 17.9% |
Similar Demographics by In Labor Force | Age 20-24
Demographics Similar to Bulgarians by In Labor Force | Age 20-24
In terms of in labor force | age 20-24, the demographic groups most similar to Bulgarians are Spanish (76.4%, a difference of 0.010%), Immigrants from Burma/Myanmar (76.3%, a difference of 0.050%), Immigrants from Iraq (76.4%, a difference of 0.060%), Immigrants from Thailand (76.4%, a difference of 0.060%), and Sierra Leonean (76.3%, a difference of 0.060%).
| Demographics | Rating | Rank | In Labor Force | Age 20-24 |
| Hmong | 99.5 /100 | #82 | Exceptional 76.5% |
| Carpatho Rusyns | 99.4 /100 | #83 | Exceptional 76.5% |
| Austrians | 99.4 /100 | #84 | Exceptional 76.5% |
| Portuguese | 99.3 /100 | #85 | Exceptional 76.4% |
| Immigrants | Iraq | 99.3 /100 | #86 | Exceptional 76.4% |
| Immigrants | Thailand | 99.3 /100 | #87 | Exceptional 76.4% |
| Spanish | 99.2 /100 | #88 | Exceptional 76.4% |
| Bulgarians | 99.2 /100 | #89 | Exceptional 76.4% |
| Immigrants | Burma/Myanmar | 99.1 /100 | #90 | Exceptional 76.3% |
| Sierra Leoneans | 99.0 /100 | #91 | Exceptional 76.3% |
| Maltese | 98.9 /100 | #92 | Exceptional 76.3% |
| Hungarians | 98.9 /100 | #93 | Exceptional 76.3% |
| Potawatomi | 98.5 /100 | #94 | Exceptional 76.2% |
| Immigrants | Germany | 98.5 /100 | #95 | Exceptional 76.2% |
| Immigrants | Nonimmigrants | 98.5 /100 | #96 | Exceptional 76.2% |
Demographics Similar to Crow by In Labor Force | Age 20-24
In terms of in labor force | age 20-24, the demographic groups most similar to Crow are Icelander (76.9%, a difference of 0.020%), Slavic (76.9%, a difference of 0.020%), White/Caucasian (76.9%, a difference of 0.050%), French American Indian (76.8%, a difference of 0.060%), and Immigrants from Sudan (76.8%, a difference of 0.080%).
| Demographics | Rating | Rank | In Labor Force | Age 20-24 |
| Hawaiians | 99.9 /100 | #58 | Exceptional 77.0% |
| Scotch-Irish | 99.9 /100 | #59 | Exceptional 77.0% |
| Kenyans | 99.9 /100 | #60 | Exceptional 77.0% |
| Immigrants | Eritrea | 99.9 /100 | #61 | Exceptional 77.0% |
| Immigrants | Kenya | 99.9 /100 | #62 | Exceptional 77.0% |
| Lithuanians | 99.9 /100 | #63 | Exceptional 77.0% |
| Whites/Caucasians | 99.9 /100 | #64 | Exceptional 76.9% |
| Crow | 99.9 /100 | #65 | Exceptional 76.9% |
| Icelanders | 99.9 /100 | #66 | Exceptional 76.9% |
| Slavs | 99.9 /100 | #67 | Exceptional 76.9% |
| French American Indians | 99.8 /100 | #68 | Exceptional 76.8% |
| Immigrants | Sudan | 99.8 /100 | #69 | Exceptional 76.8% |
| Ottawa | 99.8 /100 | #70 | Exceptional 76.8% |
| Northern Europeans | 99.8 /100 | #71 | Exceptional 76.8% |
| Guamanians/Chamorros | 99.8 /100 | #72 | Exceptional 76.7% |