Immigrants from Trinidad and Tobago vs Immigrants from France No Schooling Completed
COMPARE
Immigrants from Trinidad and Tobago
Immigrants from France
No Schooling Completed
No Schooling Completed Comparison
Immigrants from Trinidad and Tobago
Immigrants from France
2.6%
NO SCHOOLING COMPLETED
0.0/ 100
METRIC RATING
283rd/ 347
METRIC RANK
1.8%
NO SCHOOLING COMPLETED
97.3/ 100
METRIC RATING
106th/ 347
METRIC RANK
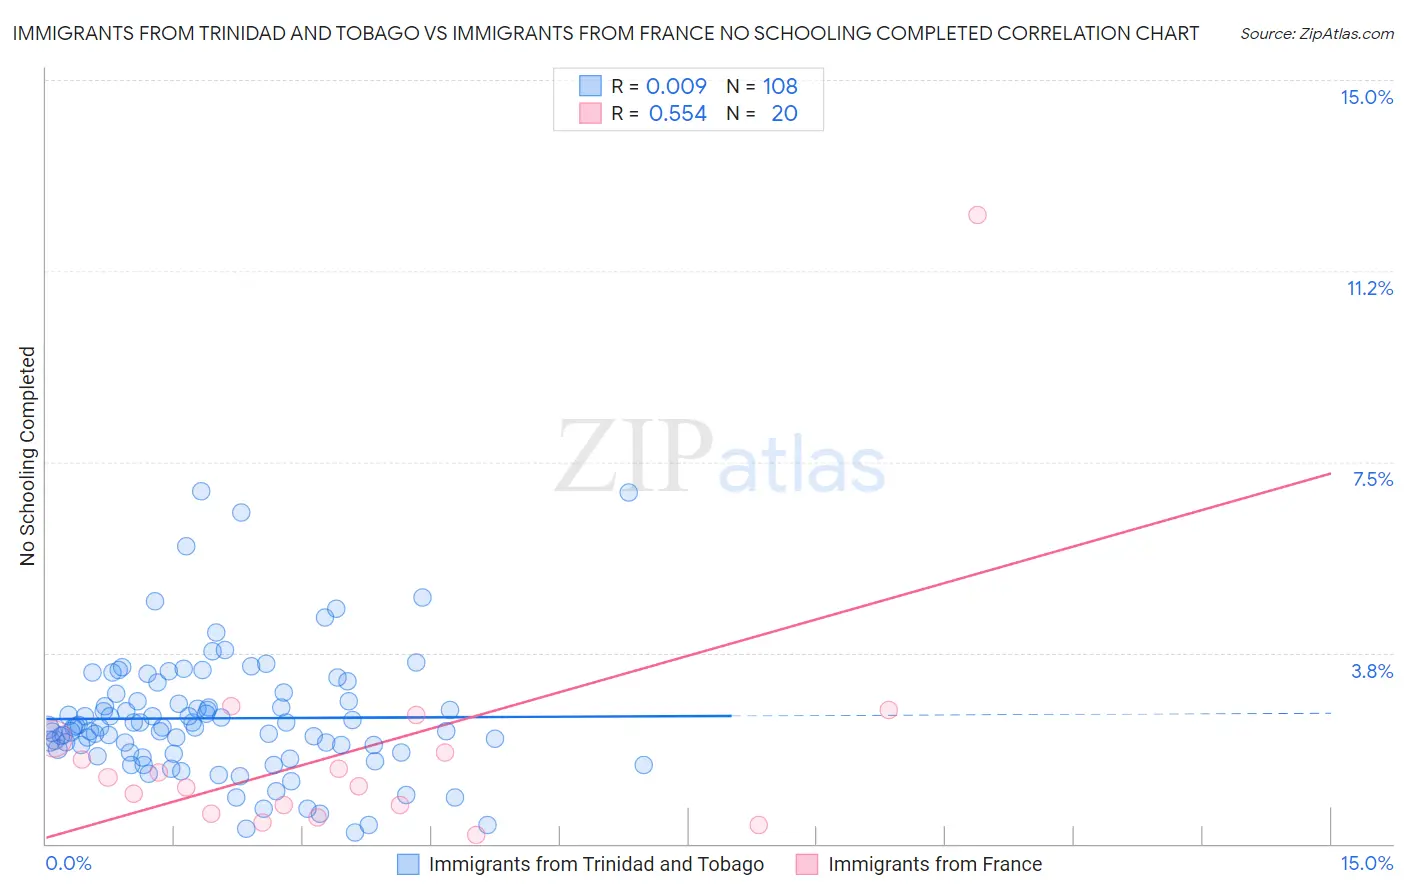
Immigrants from Trinidad and Tobago vs Immigrants from France No Schooling Completed Correlation Chart
The statistical analysis conducted on geographies consisting of 222,835,417 people shows no correlation between the proportion of Immigrants from Trinidad and Tobago and percentage of population with no schooling in the United States with a correlation coefficient (R) of 0.009 and weighted average of 2.6%. Similarly, the statistical analysis conducted on geographies consisting of 285,710,954 people shows a substantial positive correlation between the proportion of Immigrants from France and percentage of population with no schooling in the United States with a correlation coefficient (R) of 0.554 and weighted average of 1.8%, a difference of 43.2%.
No Schooling Completed Correlation Summary
| Measurement | Immigrants from Trinidad and Tobago | Immigrants from France |
| Minimum | 0.21% | 0.17% |
| Maximum | 6.9% | 12.3% |
| Range | 6.7% | 12.2% |
| Mean | 2.5% | 1.8% |
| Median | 2.3% | 1.2% |
| Interquartile 25% (IQ1) | 1.8% | 0.68% |
| Interquartile 75% (IQ3) | 2.9% | 1.9% |
| Interquartile Range (IQR) | 1.1% | 1.2% |
| Standard Deviation (Sample) | 1.2% | 2.6% |
| Standard Deviation (Population) | 1.2% | 2.5% |
Similar Demographics by No Schooling Completed
Demographics Similar to Immigrants from Trinidad and Tobago by No Schooling Completed
In terms of no schooling completed, the demographic groups most similar to Immigrants from Trinidad and Tobago are Immigrants from West Indies (2.7%, a difference of 0.72%), Immigrants from Barbados (2.7%, a difference of 0.80%), Immigrants from Ghana (2.6%, a difference of 1.2%), Immigrants from Portugal (2.7%, a difference of 1.2%), and Afghan (2.6%, a difference of 1.4%).
| Demographics | Rating | Rank | No Schooling Completed |
| Immigrants | Western Africa | 0.1 /100 | #276 | Tragic 2.6% |
| Immigrants | Philippines | 0.1 /100 | #277 | Tragic 2.6% |
| Immigrants | Uzbekistan | 0.1 /100 | #278 | Tragic 2.6% |
| Barbadians | 0.1 /100 | #279 | Tragic 2.6% |
| Trinidadians and Tobagonians | 0.1 /100 | #280 | Tragic 2.6% |
| Afghans | 0.1 /100 | #281 | Tragic 2.6% |
| Immigrants | Ghana | 0.1 /100 | #282 | Tragic 2.6% |
| Immigrants | Trinidad and Tobago | 0.0 /100 | #283 | Tragic 2.6% |
| Immigrants | West Indies | 0.0 /100 | #284 | Tragic 2.7% |
| Immigrants | Barbados | 0.0 /100 | #285 | Tragic 2.7% |
| Immigrants | Portugal | 0.0 /100 | #286 | Tragic 2.7% |
| Immigrants | Afghanistan | 0.0 /100 | #287 | Tragic 2.7% |
| Immigrants | St. Vincent and the Grenadines | 0.0 /100 | #288 | Tragic 2.7% |
| Immigrants | Thailand | 0.0 /100 | #289 | Tragic 2.7% |
| Immigrants | Hong Kong | 0.0 /100 | #290 | Tragic 2.7% |
Demographics Similar to Immigrants from France by No Schooling Completed
In terms of no schooling completed, the demographic groups most similar to Immigrants from France are Yugoslavian (1.8%, a difference of 0.040%), Okinawan (1.8%, a difference of 0.26%), German Russian (1.8%, a difference of 0.40%), Thai (1.8%, a difference of 0.42%), and Immigrants from Saudi Arabia (1.9%, a difference of 0.60%).
| Demographics | Rating | Rank | No Schooling Completed |
| Choctaw | 98.1 /100 | #99 | Exceptional 1.8% |
| Immigrants | Singapore | 98.0 /100 | #100 | Exceptional 1.8% |
| Immigrants | Czechoslovakia | 97.9 /100 | #101 | Exceptional 1.8% |
| Immigrants | Switzerland | 97.9 /100 | #102 | Exceptional 1.8% |
| Basques | 97.9 /100 | #103 | Exceptional 1.8% |
| Thais | 97.5 /100 | #104 | Exceptional 1.8% |
| German Russians | 97.5 /100 | #105 | Exceptional 1.8% |
| Immigrants | France | 97.3 /100 | #106 | Exceptional 1.8% |
| Yugoslavians | 97.2 /100 | #107 | Exceptional 1.8% |
| Okinawans | 97.1 /100 | #108 | Exceptional 1.8% |
| Immigrants | Saudi Arabia | 96.8 /100 | #109 | Exceptional 1.9% |
| Immigrants | Latvia | 96.7 /100 | #110 | Exceptional 1.9% |
| Immigrants | Japan | 96.6 /100 | #111 | Exceptional 1.9% |
| Pueblo | 96.4 /100 | #112 | Exceptional 1.9% |
| Immigrants | Zimbabwe | 96.2 /100 | #113 | Exceptional 1.9% |