Immigrants from Sudan vs Delaware 10th Grade
COMPARE
Immigrants from Sudan
Delaware
10th Grade
10th Grade Comparison
Immigrants from Sudan
Delaware
93.4%
10TH GRADE
20.0/ 100
METRIC RATING
206th/ 347
METRIC RANK
94.4%
10TH GRADE
96.3/ 100
METRIC RATING
115th/ 347
METRIC RANK
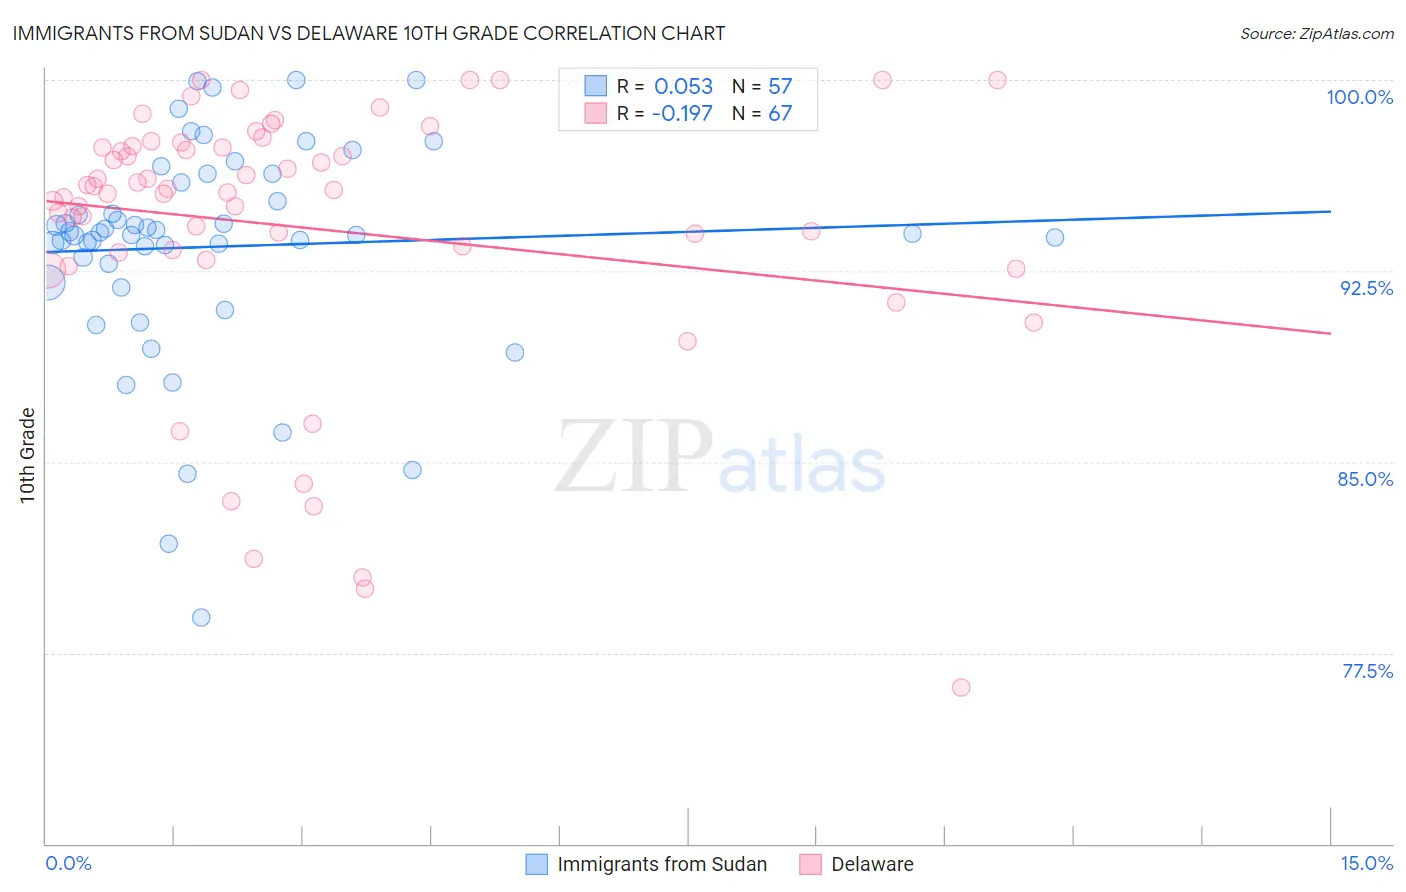
Immigrants from Sudan vs Delaware 10th Grade Correlation Chart
The statistical analysis conducted on geographies consisting of 118,959,807 people shows a slight positive correlation between the proportion of Immigrants from Sudan and percentage of population with at least 10th grade education in the United States with a correlation coefficient (R) of 0.053 and weighted average of 93.4%. Similarly, the statistical analysis conducted on geographies consisting of 96,234,866 people shows a poor negative correlation between the proportion of Delaware and percentage of population with at least 10th grade education in the United States with a correlation coefficient (R) of -0.197 and weighted average of 94.4%, a difference of 1.0%.
10th Grade Correlation Summary
| Measurement | Immigrants from Sudan | Delaware |
| Minimum | 78.9% | 76.1% |
| Maximum | 100.0% | 100.0% |
| Range | 21.1% | 23.9% |
| Mean | 93.5% | 94.2% |
| Median | 94.0% | 95.7% |
| Interquartile 25% (IQ1) | 92.4% | 93.2% |
| Interquartile 75% (IQ3) | 96.1% | 97.4% |
| Interquartile Range (IQR) | 3.7% | 4.2% |
| Standard Deviation (Sample) | 4.3% | 5.3% |
| Standard Deviation (Population) | 4.2% | 5.3% |
Similar Demographics by 10th Grade
Demographics Similar to Immigrants from Sudan by 10th Grade
In terms of 10th grade, the demographic groups most similar to Immigrants from Sudan are Ute (93.4%, a difference of 0.0%), Immigrants from Indonesia (93.4%, a difference of 0.0%), Immigrants from Uganda (93.5%, a difference of 0.010%), Immigrants from Western Asia (93.4%, a difference of 0.010%), and Samoan (93.4%, a difference of 0.010%).
| Demographics | Rating | Rank | 10th Grade |
| Asians | 23.0 /100 | #199 | Fair 93.5% |
| Hopi | 22.2 /100 | #200 | Fair 93.5% |
| Hawaiians | 21.8 /100 | #201 | Fair 93.5% |
| Immigrants | Uganda | 20.9 /100 | #202 | Fair 93.5% |
| Immigrants | Western Asia | 20.6 /100 | #203 | Fair 93.4% |
| Ute | 20.3 /100 | #204 | Fair 93.4% |
| Immigrants | Indonesia | 20.2 /100 | #205 | Fair 93.4% |
| Immigrants | Sudan | 20.0 /100 | #206 | Fair 93.4% |
| Samoans | 19.5 /100 | #207 | Poor 93.4% |
| Immigrants | Syria | 19.4 /100 | #208 | Poor 93.4% |
| Immigrants | Chile | 18.8 /100 | #209 | Poor 93.4% |
| Indians (Asian) | 17.6 /100 | #210 | Poor 93.4% |
| Cajuns | 16.9 /100 | #211 | Poor 93.4% |
| Immigrants | Zaire | 16.7 /100 | #212 | Poor 93.4% |
| Immigrants | Asia | 15.7 /100 | #213 | Poor 93.4% |
Demographics Similar to Delaware by 10th Grade
In terms of 10th grade, the demographic groups most similar to Delaware are German Russian (94.4%, a difference of 0.0%), Sioux (94.4%, a difference of 0.0%), Palestinian (94.4%, a difference of 0.020%), Immigrants from Kuwait (94.4%, a difference of 0.030%), and Immigrants from Hungary (94.4%, a difference of 0.030%).
| Demographics | Rating | Rank | 10th Grade |
| Immigrants | North Macedonia | 97.2 /100 | #108 | Exceptional 94.5% |
| Immigrants | Norway | 97.2 /100 | #109 | Exceptional 94.5% |
| Burmese | 97.1 /100 | #110 | Exceptional 94.5% |
| Immigrants | Zimbabwe | 96.8 /100 | #111 | Exceptional 94.4% |
| Immigrants | Kuwait | 96.8 /100 | #112 | Exceptional 94.4% |
| Palestinians | 96.5 /100 | #113 | Exceptional 94.4% |
| German Russians | 96.3 /100 | #114 | Exceptional 94.4% |
| Delaware | 96.3 /100 | #115 | Exceptional 94.4% |
| Sioux | 96.2 /100 | #116 | Exceptional 94.4% |
| Immigrants | Hungary | 95.8 /100 | #117 | Exceptional 94.4% |
| Jordanians | 95.6 /100 | #118 | Exceptional 94.4% |
| Immigrants | Israel | 95.4 /100 | #119 | Exceptional 94.4% |
| Immigrants | Taiwan | 95.3 /100 | #120 | Exceptional 94.4% |
| Immigrants | Belarus | 95.2 /100 | #121 | Exceptional 94.4% |
| Inupiat | 95.1 /100 | #122 | Exceptional 94.4% |