Immigrants from Spain vs Immigrants from Cameroon In Labor Force | Age 25-29
COMPARE
Immigrants from Spain
Immigrants from Cameroon
In Labor Force | Age 25-29
In Labor Force | Age 25-29 Comparison
Immigrants from Spain
Immigrants from Cameroon
84.7%
IN LABOR FORCE | AGE 25-29
56.9/ 100
METRIC RATING
166th/ 347
METRIC RANK
85.4%
IN LABOR FORCE | AGE 25-29
99.2/ 100
METRIC RATING
68th/ 347
METRIC RANK
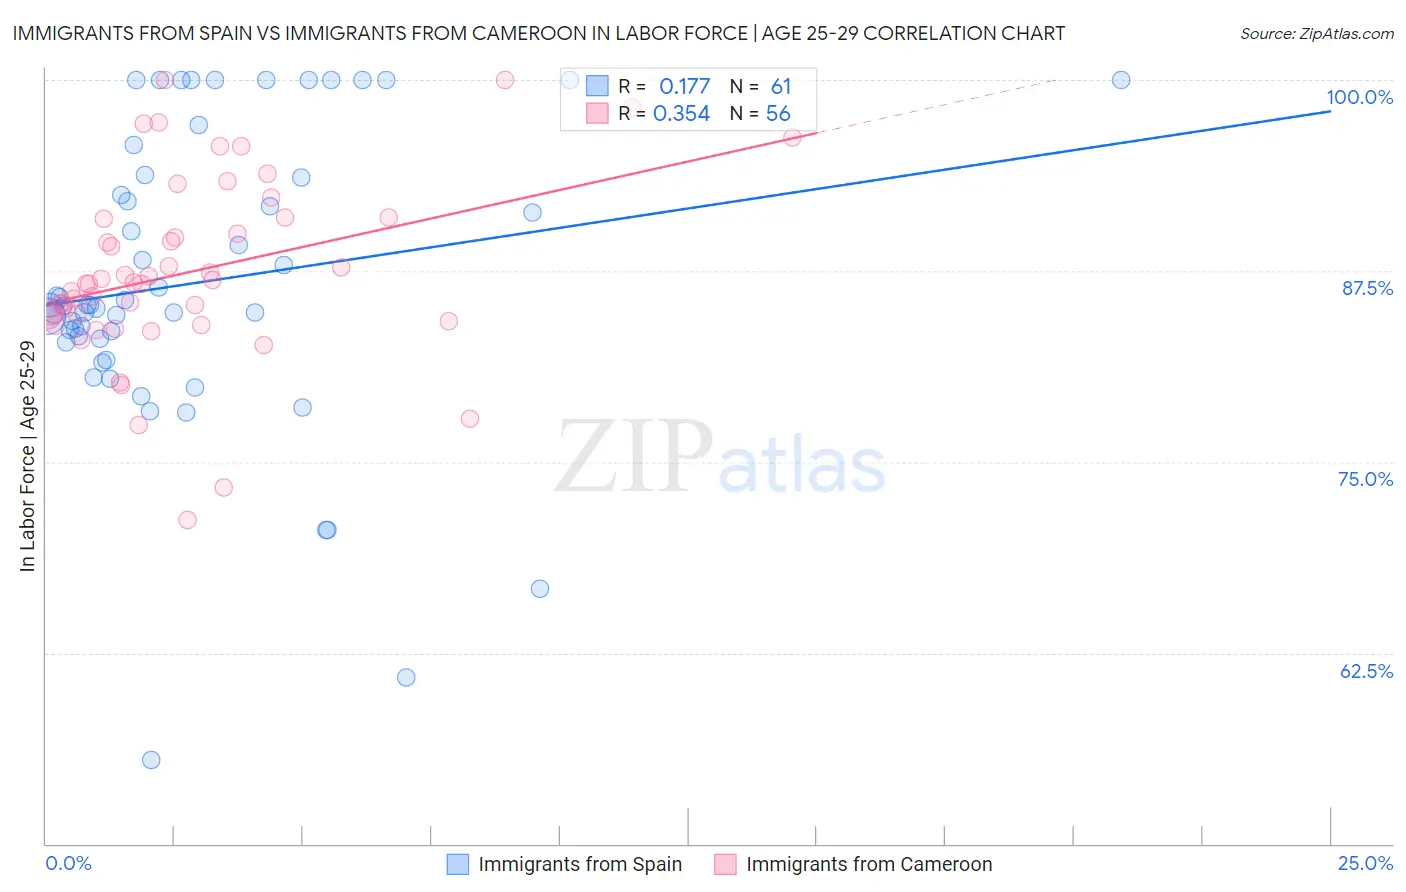
Immigrants from Spain vs Immigrants from Cameroon In Labor Force | Age 25-29 Correlation Chart
The statistical analysis conducted on geographies consisting of 239,645,733 people shows a poor positive correlation between the proportion of Immigrants from Spain and labor force participation rate among population between the ages 25 and 29 in the United States with a correlation coefficient (R) of 0.177 and weighted average of 84.7%. Similarly, the statistical analysis conducted on geographies consisting of 130,753,894 people shows a mild positive correlation between the proportion of Immigrants from Cameroon and labor force participation rate among population between the ages 25 and 29 in the United States with a correlation coefficient (R) of 0.354 and weighted average of 85.4%, a difference of 0.83%.
In Labor Force | Age 25-29 Correlation Summary
| Measurement | Immigrants from Spain | Immigrants from Cameroon |
| Minimum | 55.5% | 71.2% |
| Maximum | 100.0% | 100.0% |
| Range | 44.5% | 28.8% |
| Mean | 86.8% | 87.5% |
| Median | 85.3% | 86.7% |
| Interquartile 25% (IQ1) | 82.9% | 84.4% |
| Interquartile 75% (IQ3) | 93.7% | 90.9% |
| Interquartile Range (IQR) | 10.8% | 6.5% |
| Standard Deviation (Sample) | 9.7% | 6.0% |
| Standard Deviation (Population) | 9.6% | 5.9% |
Similar Demographics by In Labor Force | Age 25-29
Demographics Similar to Immigrants from Spain by In Labor Force | Age 25-29
In terms of in labor force | age 25-29, the demographic groups most similar to Immigrants from Spain are Immigrants from Burma/Myanmar (84.7%, a difference of 0.0%), Indonesian (84.7%, a difference of 0.0%), Immigrants from Peru (84.7%, a difference of 0.010%), Canadian (84.7%, a difference of 0.010%), and Immigrants from Colombia (84.7%, a difference of 0.010%).
| Demographics | Rating | Rank | In Labor Force | Age 25-29 |
| Immigrants | Western Africa | 60.1 /100 | #159 | Good 84.7% |
| Immigrants | Peru | 58.6 /100 | #160 | Average 84.7% |
| Canadians | 58.5 /100 | #161 | Average 84.7% |
| Immigrants | Colombia | 58.3 /100 | #162 | Average 84.7% |
| Argentineans | 57.9 /100 | #163 | Average 84.7% |
| Ghanaians | 57.6 /100 | #164 | Average 84.7% |
| Immigrants | Burma/Myanmar | 57.4 /100 | #165 | Average 84.7% |
| Immigrants | Spain | 56.9 /100 | #166 | Average 84.7% |
| Indonesians | 56.5 /100 | #167 | Average 84.7% |
| South Americans | 54.9 /100 | #168 | Average 84.7% |
| Celtics | 52.5 /100 | #169 | Average 84.7% |
| Tongans | 52.4 /100 | #170 | Average 84.7% |
| Immigrants | Vietnam | 50.5 /100 | #171 | Average 84.7% |
| Immigrants | Western Europe | 50.4 /100 | #172 | Average 84.7% |
| Assyrians/Chaldeans/Syriacs | 50.2 /100 | #173 | Average 84.7% |
Demographics Similar to Immigrants from Cameroon by In Labor Force | Age 25-29
In terms of in labor force | age 25-29, the demographic groups most similar to Immigrants from Cameroon are Immigrants from Turkey (85.4%, a difference of 0.010%), Immigrants from Czechoslovakia (85.4%, a difference of 0.020%), Immigrants from Scotland (85.4%, a difference of 0.020%), Menominee (85.4%, a difference of 0.020%), and Immigrants from Sweden (85.4%, a difference of 0.020%).
| Demographics | Rating | Rank | In Labor Force | Age 25-29 |
| Serbians | 99.5 /100 | #61 | Exceptional 85.5% |
| Taiwanese | 99.4 /100 | #62 | Exceptional 85.4% |
| Immigrants | Kenya | 99.4 /100 | #63 | Exceptional 85.4% |
| Immigrants | Italy | 99.3 /100 | #64 | Exceptional 85.4% |
| Immigrants | Czechoslovakia | 99.3 /100 | #65 | Exceptional 85.4% |
| Immigrants | Scotland | 99.3 /100 | #66 | Exceptional 85.4% |
| Immigrants | Turkey | 99.2 /100 | #67 | Exceptional 85.4% |
| Immigrants | Cameroon | 99.2 /100 | #68 | Exceptional 85.4% |
| Menominee | 99.1 /100 | #69 | Exceptional 85.4% |
| Immigrants | Sweden | 99.1 /100 | #70 | Exceptional 85.4% |
| Kenyans | 99.0 /100 | #71 | Exceptional 85.4% |
| Immigrants | Australia | 98.9 /100 | #72 | Exceptional 85.3% |
| Russians | 98.8 /100 | #73 | Exceptional 85.3% |
| Soviet Union | 98.5 /100 | #74 | Exceptional 85.3% |
| Brazilians | 98.3 /100 | #75 | Exceptional 85.3% |