Immigrants from Spain vs Hungarian 5th Grade
COMPARE
Immigrants from Spain
Hungarian
5th Grade
5th Grade Comparison
Immigrants from Spain
Hungarians
97.3%
5TH GRADE
47.0/ 100
METRIC RATING
177th/ 347
METRIC RANK
98.0%
5TH GRADE
99.9/ 100
METRIC RATING
41st/ 347
METRIC RANK
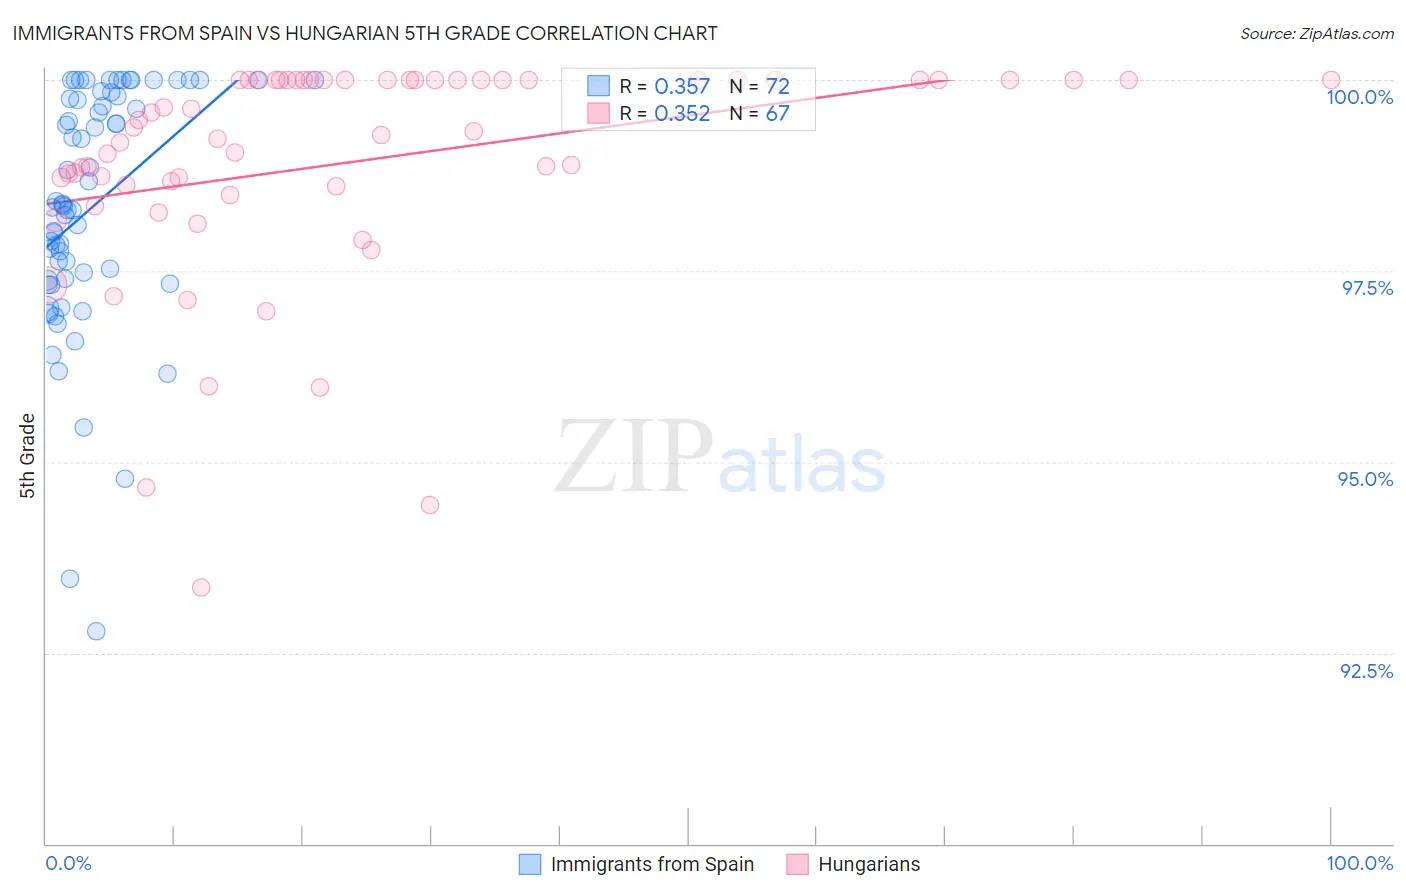
Immigrants from Spain vs Hungarian 5th Grade Correlation Chart
The statistical analysis conducted on geographies consisting of 239,682,725 people shows a mild positive correlation between the proportion of Immigrants from Spain and percentage of population with at least 5th grade education in the United States with a correlation coefficient (R) of 0.357 and weighted average of 97.3%. Similarly, the statistical analysis conducted on geographies consisting of 486,239,314 people shows a mild positive correlation between the proportion of Hungarians and percentage of population with at least 5th grade education in the United States with a correlation coefficient (R) of 0.352 and weighted average of 98.0%, a difference of 0.74%.
5th Grade Correlation Summary
| Measurement | Immigrants from Spain | Hungarian |
| Minimum | 92.8% | 93.3% |
| Maximum | 100.0% | 100.0% |
| Range | 7.2% | 6.7% |
| Mean | 98.3% | 98.9% |
| Median | 98.3% | 99.3% |
| Interquartile 25% (IQ1) | 97.4% | 98.6% |
| Interquartile 75% (IQ3) | 99.8% | 100.0% |
| Interquartile Range (IQR) | 2.4% | 1.4% |
| Standard Deviation (Sample) | 1.6% | 1.5% |
| Standard Deviation (Population) | 1.6% | 1.4% |
Similar Demographics by 5th Grade
Demographics Similar to Immigrants from Spain by 5th Grade
In terms of 5th grade, the demographic groups most similar to Immigrants from Spain are Immigrants from Kazakhstan (97.3%, a difference of 0.010%), Immigrants from Micronesia (97.3%, a difference of 0.010%), Immigrants from Taiwan (97.3%, a difference of 0.010%), Egyptian (97.3%, a difference of 0.020%), and Comanche (97.3%, a difference of 0.020%).
| Demographics | Rating | Rank | 5th Grade |
| Venezuelans | 54.0 /100 | #170 | Average 97.3% |
| Immigrants | Sri Lanka | 53.8 /100 | #171 | Average 97.3% |
| Arabs | 53.4 /100 | #172 | Average 97.3% |
| Egyptians | 52.4 /100 | #173 | Average 97.3% |
| Immigrants | Kazakhstan | 50.0 /100 | #174 | Average 97.3% |
| Immigrants | Micronesia | 48.8 /100 | #175 | Average 97.3% |
| Immigrants | Taiwan | 48.4 /100 | #176 | Average 97.3% |
| Immigrants | Spain | 47.0 /100 | #177 | Average 97.3% |
| Comanche | 42.1 /100 | #178 | Average 97.3% |
| Immigrants | Kenya | 40.3 /100 | #179 | Average 97.3% |
| Pakistanis | 40.2 /100 | #180 | Average 97.3% |
| Argentineans | 39.5 /100 | #181 | Fair 97.3% |
| Mongolians | 39.4 /100 | #182 | Fair 97.3% |
| Immigrants | Ukraine | 38.6 /100 | #183 | Fair 97.3% |
| Immigrants | Venezuela | 38.4 /100 | #184 | Fair 97.3% |
Demographics Similar to Hungarians by 5th Grade
In terms of 5th grade, the demographic groups most similar to Hungarians are Northern European (98.0%, a difference of 0.010%), Eastern European (98.1%, a difference of 0.020%), Ottawa (98.0%, a difference of 0.020%), Luxembourger (98.1%, a difference of 0.030%), and Aleut (98.0%, a difference of 0.030%).
| Demographics | Rating | Rank | 5th Grade |
| Chinese | 100.0 /100 | #34 | Exceptional 98.1% |
| Italians | 100.0 /100 | #35 | Exceptional 98.1% |
| British | 100.0 /100 | #36 | Exceptional 98.1% |
| Latvians | 99.9 /100 | #37 | Exceptional 98.1% |
| Belgians | 99.9 /100 | #38 | Exceptional 98.1% |
| Luxembourgers | 99.9 /100 | #39 | Exceptional 98.1% |
| Eastern Europeans | 99.9 /100 | #40 | Exceptional 98.1% |
| Hungarians | 99.9 /100 | #41 | Exceptional 98.0% |
| Northern Europeans | 99.9 /100 | #42 | Exceptional 98.0% |
| Ottawa | 99.9 /100 | #43 | Exceptional 98.0% |
| Aleuts | 99.9 /100 | #44 | Exceptional 98.0% |
| Czechoslovakians | 99.9 /100 | #45 | Exceptional 98.0% |
| Arapaho | 99.9 /100 | #46 | Exceptional 98.0% |
| Native Hawaiians | 99.9 /100 | #47 | Exceptional 98.0% |
| Bulgarians | 99.8 /100 | #48 | Exceptional 98.0% |