Immigrants from Spain vs Immigrants from Indonesia In Labor Force | Age 25-29
COMPARE
Immigrants from Spain
Immigrants from Indonesia
In Labor Force | Age 25-29
In Labor Force | Age 25-29 Comparison
Immigrants from Spain
Immigrants from Indonesia
84.7%
IN LABOR FORCE | AGE 25-29
56.9/ 100
METRIC RATING
166th/ 347
METRIC RANK
84.4%
IN LABOR FORCE | AGE 25-29
13.2/ 100
METRIC RATING
208th/ 347
METRIC RANK
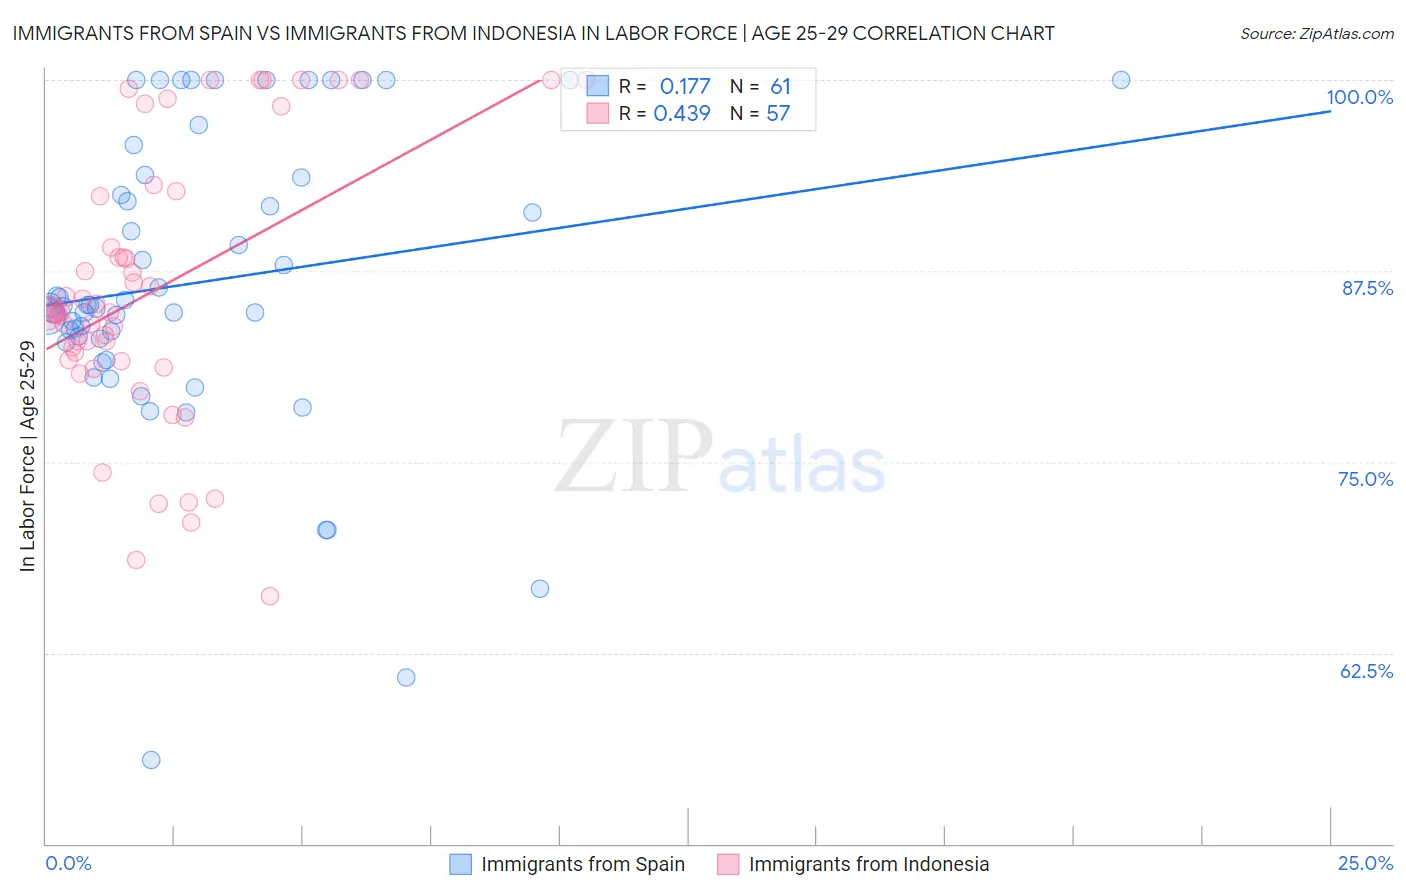
Immigrants from Spain vs Immigrants from Indonesia In Labor Force | Age 25-29 Correlation Chart
The statistical analysis conducted on geographies consisting of 239,645,733 people shows a poor positive correlation between the proportion of Immigrants from Spain and labor force participation rate among population between the ages 25 and 29 in the United States with a correlation coefficient (R) of 0.177 and weighted average of 84.7%. Similarly, the statistical analysis conducted on geographies consisting of 215,766,008 people shows a moderate positive correlation between the proportion of Immigrants from Indonesia and labor force participation rate among population between the ages 25 and 29 in the United States with a correlation coefficient (R) of 0.439 and weighted average of 84.4%, a difference of 0.40%.
In Labor Force | Age 25-29 Correlation Summary
| Measurement | Immigrants from Spain | Immigrants from Indonesia |
| Minimum | 55.5% | 66.2% |
| Maximum | 100.0% | 100.0% |
| Range | 44.5% | 33.8% |
| Mean | 86.8% | 86.2% |
| Median | 85.3% | 84.8% |
| Interquartile 25% (IQ1) | 82.9% | 81.6% |
| Interquartile 75% (IQ3) | 93.7% | 92.5% |
| Interquartile Range (IQR) | 10.8% | 10.9% |
| Standard Deviation (Sample) | 9.7% | 8.8% |
| Standard Deviation (Population) | 9.6% | 8.8% |
Similar Demographics by In Labor Force | Age 25-29
Demographics Similar to Immigrants from Spain by In Labor Force | Age 25-29
In terms of in labor force | age 25-29, the demographic groups most similar to Immigrants from Spain are Immigrants from Burma/Myanmar (84.7%, a difference of 0.0%), Indonesian (84.7%, a difference of 0.0%), Immigrants from Peru (84.7%, a difference of 0.010%), Canadian (84.7%, a difference of 0.010%), and Immigrants from Colombia (84.7%, a difference of 0.010%).
| Demographics | Rating | Rank | In Labor Force | Age 25-29 |
| Immigrants | Western Africa | 60.1 /100 | #159 | Good 84.7% |
| Immigrants | Peru | 58.6 /100 | #160 | Average 84.7% |
| Canadians | 58.5 /100 | #161 | Average 84.7% |
| Immigrants | Colombia | 58.3 /100 | #162 | Average 84.7% |
| Argentineans | 57.9 /100 | #163 | Average 84.7% |
| Ghanaians | 57.6 /100 | #164 | Average 84.7% |
| Immigrants | Burma/Myanmar | 57.4 /100 | #165 | Average 84.7% |
| Immigrants | Spain | 56.9 /100 | #166 | Average 84.7% |
| Indonesians | 56.5 /100 | #167 | Average 84.7% |
| South Americans | 54.9 /100 | #168 | Average 84.7% |
| Celtics | 52.5 /100 | #169 | Average 84.7% |
| Tongans | 52.4 /100 | #170 | Average 84.7% |
| Immigrants | Vietnam | 50.5 /100 | #171 | Average 84.7% |
| Immigrants | Western Europe | 50.4 /100 | #172 | Average 84.7% |
| Assyrians/Chaldeans/Syriacs | 50.2 /100 | #173 | Average 84.7% |
Demographics Similar to Immigrants from Indonesia by In Labor Force | Age 25-29
In terms of in labor force | age 25-29, the demographic groups most similar to Immigrants from Indonesia are Immigrants from Armenia (84.4%, a difference of 0.0%), Immigrants from Jordan (84.4%, a difference of 0.010%), Chinese (84.3%, a difference of 0.010%), Immigrants from Venezuela (84.3%, a difference of 0.010%), and Immigrants from Cambodia (84.4%, a difference of 0.020%).
| Demographics | Rating | Rank | In Labor Force | Age 25-29 |
| Laotians | 16.6 /100 | #201 | Poor 84.4% |
| Afghans | 15.9 /100 | #202 | Poor 84.4% |
| Immigrants | Afghanistan | 15.6 /100 | #203 | Poor 84.4% |
| Venezuelans | 15.1 /100 | #204 | Poor 84.4% |
| Ecuadorians | 14.8 /100 | #205 | Poor 84.4% |
| Immigrants | Cambodia | 14.3 /100 | #206 | Poor 84.4% |
| Immigrants | Armenia | 13.3 /100 | #207 | Poor 84.4% |
| Immigrants | Indonesia | 13.2 /100 | #208 | Poor 84.4% |
| Immigrants | Jordan | 12.8 /100 | #209 | Poor 84.4% |
| Chinese | 12.7 /100 | #210 | Poor 84.3% |
| Immigrants | Venezuela | 12.6 /100 | #211 | Poor 84.3% |
| Sub-Saharan Africans | 11.7 /100 | #212 | Poor 84.3% |
| Japanese | 11.4 /100 | #213 | Poor 84.3% |
| Lebanese | 11.1 /100 | #214 | Poor 84.3% |
| Immigrants | Syria | 10.7 /100 | #215 | Poor 84.3% |