Immigrants from South Central Asia vs Soviet Union In Labor Force | Age 16-19
COMPARE
Immigrants from South Central Asia
Soviet Union
In Labor Force | Age 16-19
In Labor Force | Age 16-19 Comparison
Immigrants from South Central Asia
Soviet Union
34.6%
IN LABOR FORCE | AGE 16-19
1.3/ 100
METRIC RATING
256th/ 347
METRIC RANK
31.4%
IN LABOR FORCE | AGE 16-19
0.0/ 100
METRIC RATING
319th/ 347
METRIC RANK
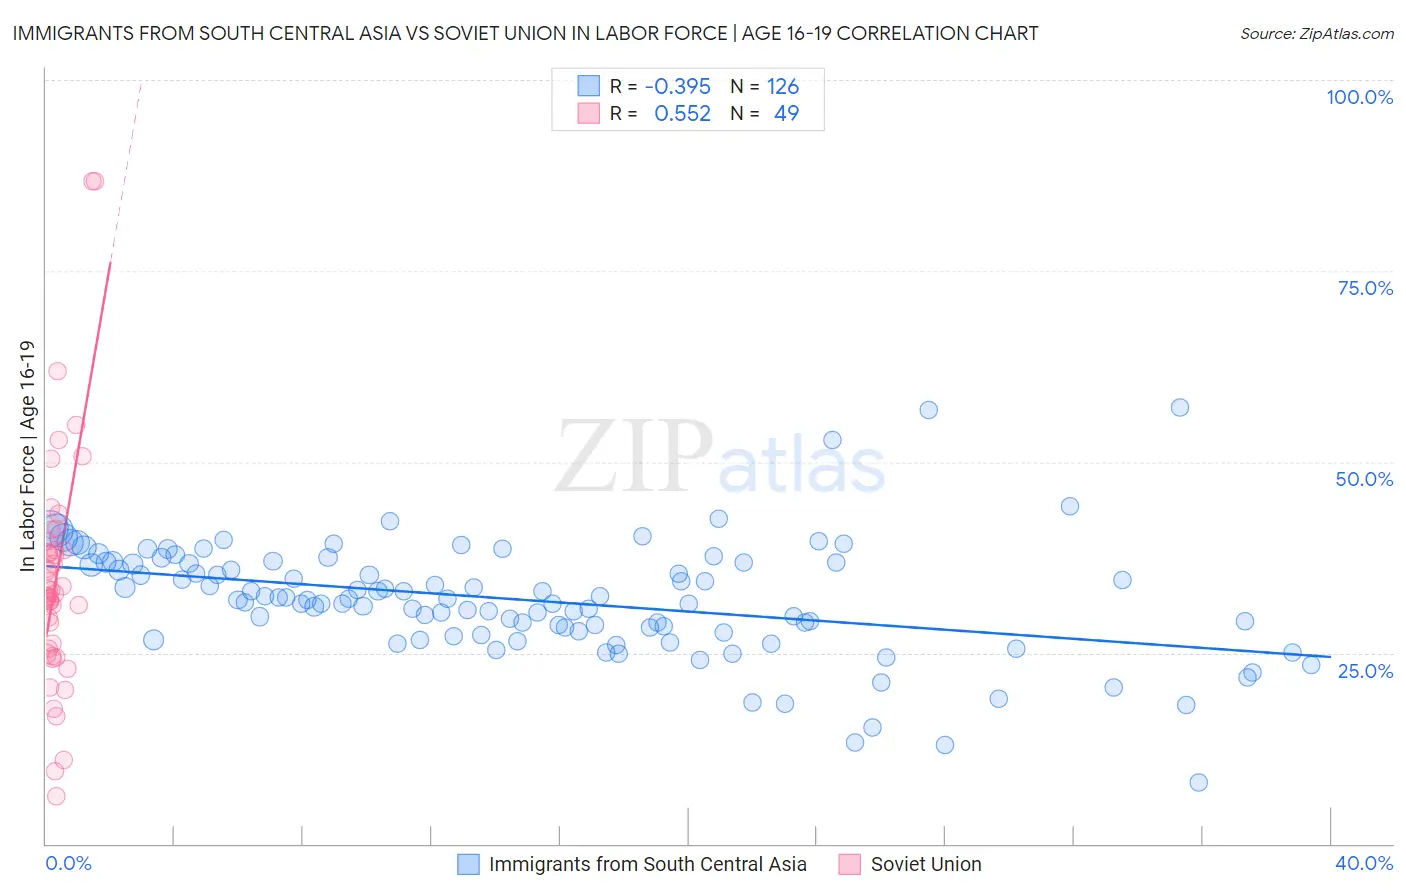
Immigrants from South Central Asia vs Soviet Union In Labor Force | Age 16-19 Correlation Chart
The statistical analysis conducted on geographies consisting of 472,115,332 people shows a mild negative correlation between the proportion of Immigrants from South Central Asia and labor force participation rate among population between the ages 16 and 19 in the United States with a correlation coefficient (R) of -0.395 and weighted average of 34.6%. Similarly, the statistical analysis conducted on geographies consisting of 43,506,709 people shows a substantial positive correlation between the proportion of Soviet Union and labor force participation rate among population between the ages 16 and 19 in the United States with a correlation coefficient (R) of 0.552 and weighted average of 31.4%, a difference of 10.0%.
In Labor Force | Age 16-19 Correlation Summary
| Measurement | Immigrants from South Central Asia | Soviet Union |
| Minimum | 8.1% | 6.3% |
| Maximum | 57.1% | 86.7% |
| Range | 49.0% | 80.4% |
| Mean | 31.9% | 34.8% |
| Median | 32.0% | 32.7% |
| Interquartile 25% (IQ1) | 27.9% | 25.2% |
| Interquartile 75% (IQ3) | 36.8% | 39.1% |
| Interquartile Range (IQR) | 8.9% | 13.9% |
| Standard Deviation (Sample) | 7.5% | 15.5% |
| Standard Deviation (Population) | 7.5% | 15.4% |
Similar Demographics by In Labor Force | Age 16-19
Demographics Similar to Immigrants from South Central Asia by In Labor Force | Age 16-19
In terms of in labor force | age 16-19, the demographic groups most similar to Immigrants from South Central Asia are Immigrants from Egypt (34.6%, a difference of 0.010%), Thai (34.6%, a difference of 0.010%), Immigrants (34.6%, a difference of 0.030%), Peruvian (34.6%, a difference of 0.11%), and Egyptian (34.5%, a difference of 0.11%).
| Demographics | Rating | Rank | In Labor Force | Age 16-19 |
| Immigrants | Ukraine | 2.2 /100 | #249 | Tragic 34.8% |
| Immigrants | Pakistan | 2.0 /100 | #250 | Tragic 34.8% |
| Immigrants | Western Asia | 2.0 /100 | #251 | Tragic 34.8% |
| Immigrants | Chile | 2.0 /100 | #252 | Tragic 34.8% |
| Immigrants | Japan | 1.5 /100 | #253 | Tragic 34.7% |
| Bahamians | 1.4 /100 | #254 | Tragic 34.6% |
| Peruvians | 1.4 /100 | #255 | Tragic 34.6% |
| Immigrants | South Central Asia | 1.3 /100 | #256 | Tragic 34.6% |
| Immigrants | Egypt | 1.2 /100 | #257 | Tragic 34.6% |
| Thais | 1.2 /100 | #258 | Tragic 34.6% |
| Immigrants | Immigrants | 1.2 /100 | #259 | Tragic 34.6% |
| Egyptians | 1.2 /100 | #260 | Tragic 34.5% |
| Salvadorans | 1.1 /100 | #261 | Tragic 34.5% |
| Hispanics or Latinos | 1.1 /100 | #262 | Tragic 34.5% |
| Burmese | 1.1 /100 | #263 | Tragic 34.5% |
Demographics Similar to Soviet Union by In Labor Force | Age 16-19
In terms of in labor force | age 16-19, the demographic groups most similar to Soviet Union are Ecuadorian (31.4%, a difference of 0.060%), West Indian (31.3%, a difference of 0.30%), Immigrants from Yemen (31.5%, a difference of 0.32%), Tohono O'odham (31.3%, a difference of 0.41%), and Immigrants from Caribbean (31.2%, a difference of 0.54%).
| Demographics | Rating | Rank | In Labor Force | Age 16-19 |
| Immigrants | Belize | 0.0 /100 | #312 | Tragic 31.8% |
| Hopi | 0.0 /100 | #313 | Tragic 31.8% |
| Cubans | 0.0 /100 | #314 | Tragic 31.8% |
| Immigrants | West Indies | 0.0 /100 | #315 | Tragic 31.7% |
| Filipinos | 0.0 /100 | #316 | Tragic 31.7% |
| Immigrants | Nicaragua | 0.0 /100 | #317 | Tragic 31.6% |
| Immigrants | Yemen | 0.0 /100 | #318 | Tragic 31.5% |
| Soviet Union | 0.0 /100 | #319 | Tragic 31.4% |
| Ecuadorians | 0.0 /100 | #320 | Tragic 31.4% |
| West Indians | 0.0 /100 | #321 | Tragic 31.3% |
| Tohono O'odham | 0.0 /100 | #322 | Tragic 31.3% |
| Immigrants | Caribbean | 0.0 /100 | #323 | Tragic 31.2% |
| Dominicans | 0.0 /100 | #324 | Tragic 31.2% |
| Immigrants | China | 0.0 /100 | #325 | Tragic 31.1% |
| Immigrants | Dominican Republic | 0.0 /100 | #326 | Tragic 31.1% |