Immigrants from Somalia vs Cambodian In Labor Force | Age 35-44
COMPARE
Immigrants from Somalia
Cambodian
In Labor Force | Age 35-44
In Labor Force | Age 35-44 Comparison
Immigrants from Somalia
Cambodians
85.6%
IN LABOR FORCE | AGE 35-44
100.0/ 100
METRIC RATING
14th/ 347
METRIC RANK
85.3%
IN LABOR FORCE | AGE 35-44
99.9/ 100
METRIC RATING
29th/ 347
METRIC RANK
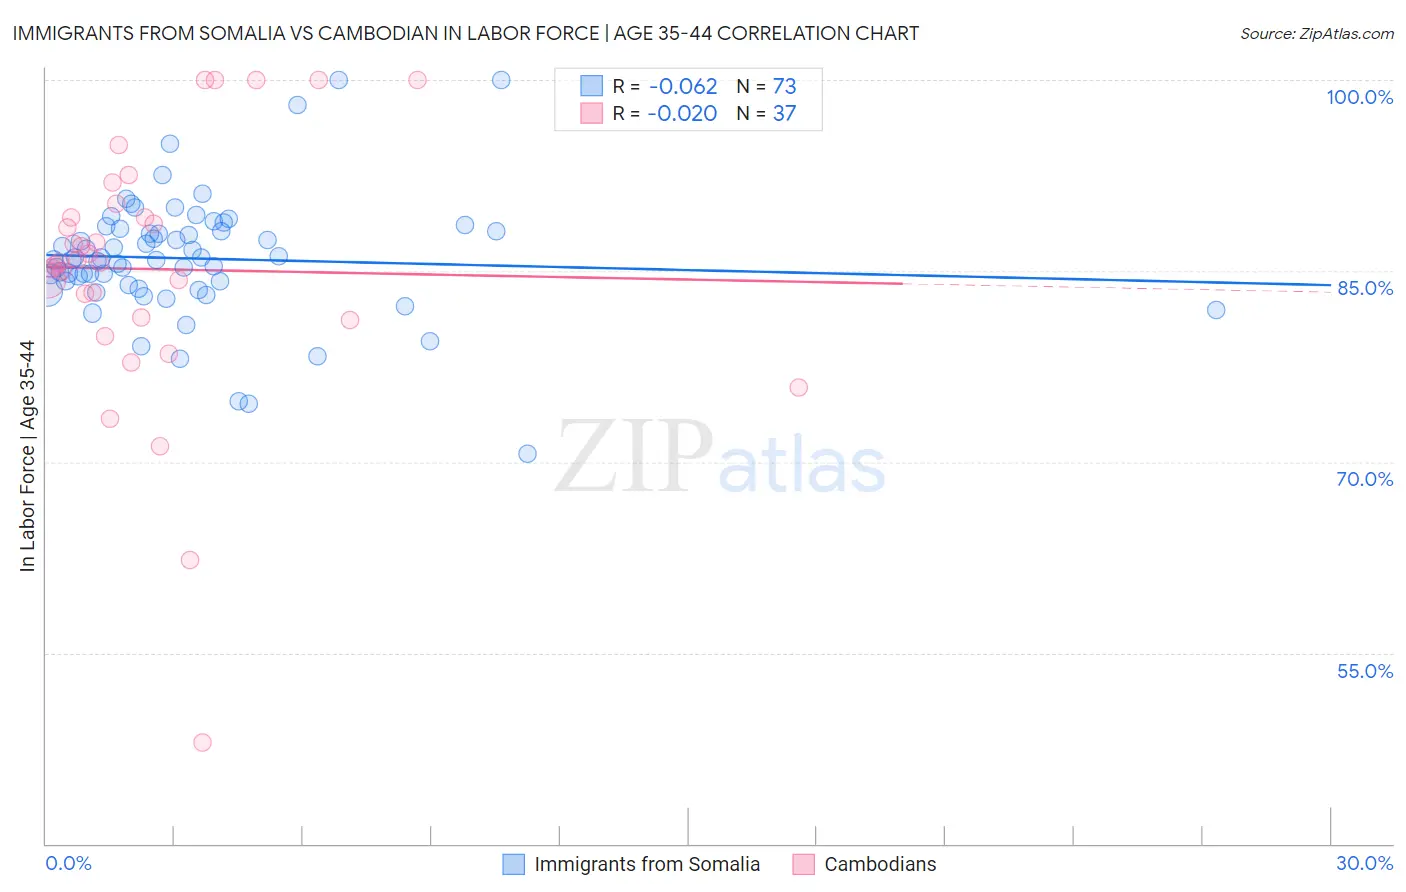
Immigrants from Somalia vs Cambodian In Labor Force | Age 35-44 Correlation Chart
The statistical analysis conducted on geographies consisting of 92,101,843 people shows a slight negative correlation between the proportion of Immigrants from Somalia and labor force participation rate among population between the ages 35 and 44 in the United States with a correlation coefficient (R) of -0.062 and weighted average of 85.6%. Similarly, the statistical analysis conducted on geographies consisting of 102,491,379 people shows no correlation between the proportion of Cambodians and labor force participation rate among population between the ages 35 and 44 in the United States with a correlation coefficient (R) of -0.020 and weighted average of 85.3%, a difference of 0.38%.
In Labor Force | Age 35-44 Correlation Summary
| Measurement | Immigrants from Somalia | Cambodian |
| Minimum | 70.6% | 48.0% |
| Maximum | 100.0% | 100.0% |
| Range | 29.4% | 52.0% |
| Mean | 86.0% | 85.1% |
| Median | 85.9% | 85.7% |
| Interquartile 25% (IQ1) | 83.8% | 81.2% |
| Interquartile 75% (IQ3) | 88.2% | 89.8% |
| Interquartile Range (IQR) | 4.4% | 8.6% |
| Standard Deviation (Sample) | 4.9% | 10.4% |
| Standard Deviation (Population) | 4.8% | 10.2% |
Demographics Similar to Immigrants from Somalia and Cambodians by In Labor Force | Age 35-44
In terms of in labor force | age 35-44, the demographic groups most similar to Immigrants from Somalia are Somali (85.6%, a difference of 0.0%), Liberian (85.7%, a difference of 0.020%), Norwegian (85.6%, a difference of 0.040%), Immigrants from Ireland (85.6%, a difference of 0.040%), and Immigrants from North Macedonia (85.6%, a difference of 0.090%). Similarly, the demographic groups most similar to Cambodians are Bermudan (85.3%, a difference of 0.010%), Czech (85.3%, a difference of 0.020%), Immigrants from Greece (85.3%, a difference of 0.040%), Immigrants from Liberia (85.4%, a difference of 0.050%), and Immigrants from Lithuania (85.4%, a difference of 0.050%).
| Demographics | Rating | Rank | In Labor Force | Age 35-44 |
| Immigrants | Cameroon | 100.0 /100 | #11 | Exceptional 85.8% |
| Liberians | 100.0 /100 | #12 | Exceptional 85.7% |
| Somalis | 100.0 /100 | #13 | Exceptional 85.6% |
| Immigrants | Somalia | 100.0 /100 | #14 | Exceptional 85.6% |
| Norwegians | 100.0 /100 | #15 | Exceptional 85.6% |
| Immigrants | Ireland | 100.0 /100 | #16 | Exceptional 85.6% |
| Immigrants | North Macedonia | 100.0 /100 | #17 | Exceptional 85.6% |
| Carpatho Rusyns | 100.0 /100 | #18 | Exceptional 85.6% |
| Slovenes | 100.0 /100 | #19 | Exceptional 85.6% |
| Immigrants | Serbia | 100.0 /100 | #20 | Exceptional 85.5% |
| Bulgarians | 100.0 /100 | #21 | Exceptional 85.5% |
| Immigrants | Bosnia and Herzegovina | 100.0 /100 | #22 | Exceptional 85.4% |
| Immigrants | Eastern Africa | 100.0 /100 | #23 | Exceptional 85.4% |
| Latvians | 99.9 /100 | #24 | Exceptional 85.4% |
| Paraguayans | 99.9 /100 | #25 | Exceptional 85.4% |
| Immigrants | Liberia | 99.9 /100 | #26 | Exceptional 85.4% |
| Immigrants | Lithuania | 99.9 /100 | #27 | Exceptional 85.4% |
| Immigrants | Greece | 99.9 /100 | #28 | Exceptional 85.3% |
| Cambodians | 99.9 /100 | #29 | Exceptional 85.3% |
| Bermudans | 99.9 /100 | #30 | Exceptional 85.3% |
| Czechs | 99.9 /100 | #31 | Exceptional 85.3% |