Romanian vs Argentinean In Labor Force | Age 20-64
COMPARE
Romanian
Argentinean
In Labor Force | Age 20-64
In Labor Force | Age 20-64 Comparison
Romanians
Argentineans
79.8%
IN LABOR FORCE | AGE 20-64
77.6/ 100
METRIC RATING
148th/ 347
METRIC RANK
80.0%
IN LABOR FORCE | AGE 20-64
93.8/ 100
METRIC RATING
114th/ 347
METRIC RANK
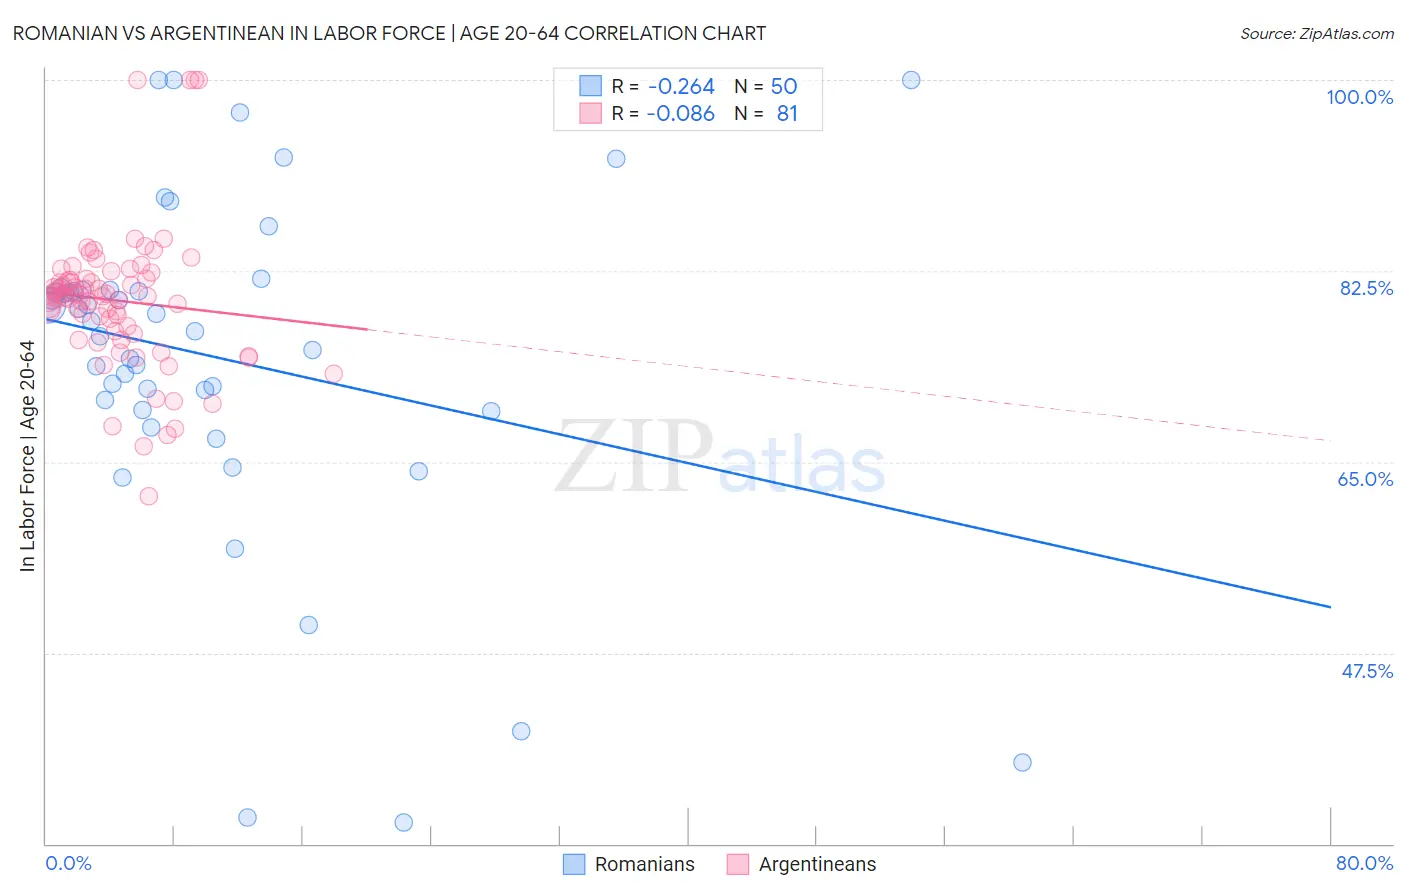
Romanian vs Argentinean In Labor Force | Age 20-64 Correlation Chart
The statistical analysis conducted on geographies consisting of 377,918,924 people shows a weak negative correlation between the proportion of Romanians and labor force participation rate among population between the ages 20 and 64 in the United States with a correlation coefficient (R) of -0.264 and weighted average of 79.8%. Similarly, the statistical analysis conducted on geographies consisting of 297,148,532 people shows a slight negative correlation between the proportion of Argentineans and labor force participation rate among population between the ages 20 and 64 in the United States with a correlation coefficient (R) of -0.086 and weighted average of 80.0%, a difference of 0.29%.
In Labor Force | Age 20-64 Correlation Summary
| Measurement | Romanian | Argentinean |
| Minimum | 31.9% | 61.9% |
| Maximum | 100.0% | 100.0% |
| Range | 68.1% | 38.1% |
| Mean | 74.5% | 79.8% |
| Median | 77.4% | 80.2% |
| Interquartile 25% (IQ1) | 69.8% | 76.9% |
| Interquartile 75% (IQ3) | 80.7% | 81.8% |
| Interquartile Range (IQR) | 10.9% | 4.9% |
| Standard Deviation (Sample) | 15.5% | 6.5% |
| Standard Deviation (Population) | 15.3% | 6.5% |
Similar Demographics by In Labor Force | Age 20-64
Demographics Similar to Romanians by In Labor Force | Age 20-64
In terms of in labor force | age 20-64, the demographic groups most similar to Romanians are Immigrants from Philippines (79.8%, a difference of 0.0%), Korean (79.8%, a difference of 0.020%), Pakistani (79.8%, a difference of 0.020%), Immigrants from Southern Europe (79.8%, a difference of 0.020%), and Immigrants from Israel (79.8%, a difference of 0.030%).
| Demographics | Rating | Rank | In Labor Force | Age 20-64 |
| Immigrants | Israel | 80.0 /100 | #141 | Good 79.8% |
| Slovaks | 79.9 /100 | #142 | Good 79.8% |
| Immigrants | Sweden | 79.7 /100 | #143 | Good 79.8% |
| Koreans | 79.6 /100 | #144 | Good 79.8% |
| Pakistanis | 79.3 /100 | #145 | Good 79.8% |
| Immigrants | Southern Europe | 78.9 /100 | #146 | Good 79.8% |
| Immigrants | Philippines | 78.0 /100 | #147 | Good 79.8% |
| Romanians | 77.6 /100 | #148 | Good 79.8% |
| Icelanders | 75.1 /100 | #149 | Good 79.7% |
| Costa Ricans | 72.4 /100 | #150 | Good 79.7% |
| Scandinavians | 72.0 /100 | #151 | Good 79.7% |
| Immigrants | Northern Europe | 72.0 /100 | #152 | Good 79.7% |
| Immigrants | Kazakhstan | 69.5 /100 | #153 | Good 79.7% |
| New Zealanders | 69.4 /100 | #154 | Good 79.7% |
| Immigrants | South Africa | 69.2 /100 | #155 | Good 79.7% |
Demographics Similar to Argentineans by In Labor Force | Age 20-64
In terms of in labor force | age 20-64, the demographic groups most similar to Argentineans are Immigrants from Italy (80.0%, a difference of 0.0%), Sri Lankan (80.0%, a difference of 0.0%), Immigrants from Argentina (80.0%, a difference of 0.010%), Estonian (80.0%, a difference of 0.010%), and Immigrants from South America (80.0%, a difference of 0.010%).
| Demographics | Rating | Rank | In Labor Force | Age 20-64 |
| Immigrants | Jordan | 94.8 /100 | #107 | Exceptional 80.0% |
| Iranians | 94.3 /100 | #108 | Exceptional 80.0% |
| Immigrants | Argentina | 94.1 /100 | #109 | Exceptional 80.0% |
| Estonians | 94.0 /100 | #110 | Exceptional 80.0% |
| Immigrants | South America | 93.9 /100 | #111 | Exceptional 80.0% |
| Immigrants | Italy | 93.9 /100 | #112 | Exceptional 80.0% |
| Sri Lankans | 93.9 /100 | #113 | Exceptional 80.0% |
| Argentineans | 93.8 /100 | #114 | Exceptional 80.0% |
| Bermudans | 93.3 /100 | #115 | Exceptional 80.0% |
| Immigrants | Western Africa | 93.1 /100 | #116 | Exceptional 80.0% |
| Immigrants | Vietnam | 92.7 /100 | #117 | Exceptional 80.0% |
| Cape Verdeans | 92.7 /100 | #118 | Exceptional 80.0% |
| Immigrants | Taiwan | 92.5 /100 | #119 | Exceptional 80.0% |
| Maltese | 92.4 /100 | #120 | Exceptional 80.0% |
| Immigrants | Kuwait | 92.2 /100 | #121 | Exceptional 80.0% |