Immigrants from Somalia vs Argentinean 12th Grade, No Diploma
COMPARE
Immigrants from Somalia
Argentinean
12th Grade, No Diploma
12th Grade, No Diploma Comparison
Immigrants from Somalia
Argentineans
90.4%
12TH GRADE, NO DIPLOMA
5.3/ 100
METRIC RATING
222nd/ 347
METRIC RANK
91.6%
12TH GRADE, NO DIPLOMA
82.0/ 100
METRIC RATING
141st/ 347
METRIC RANK
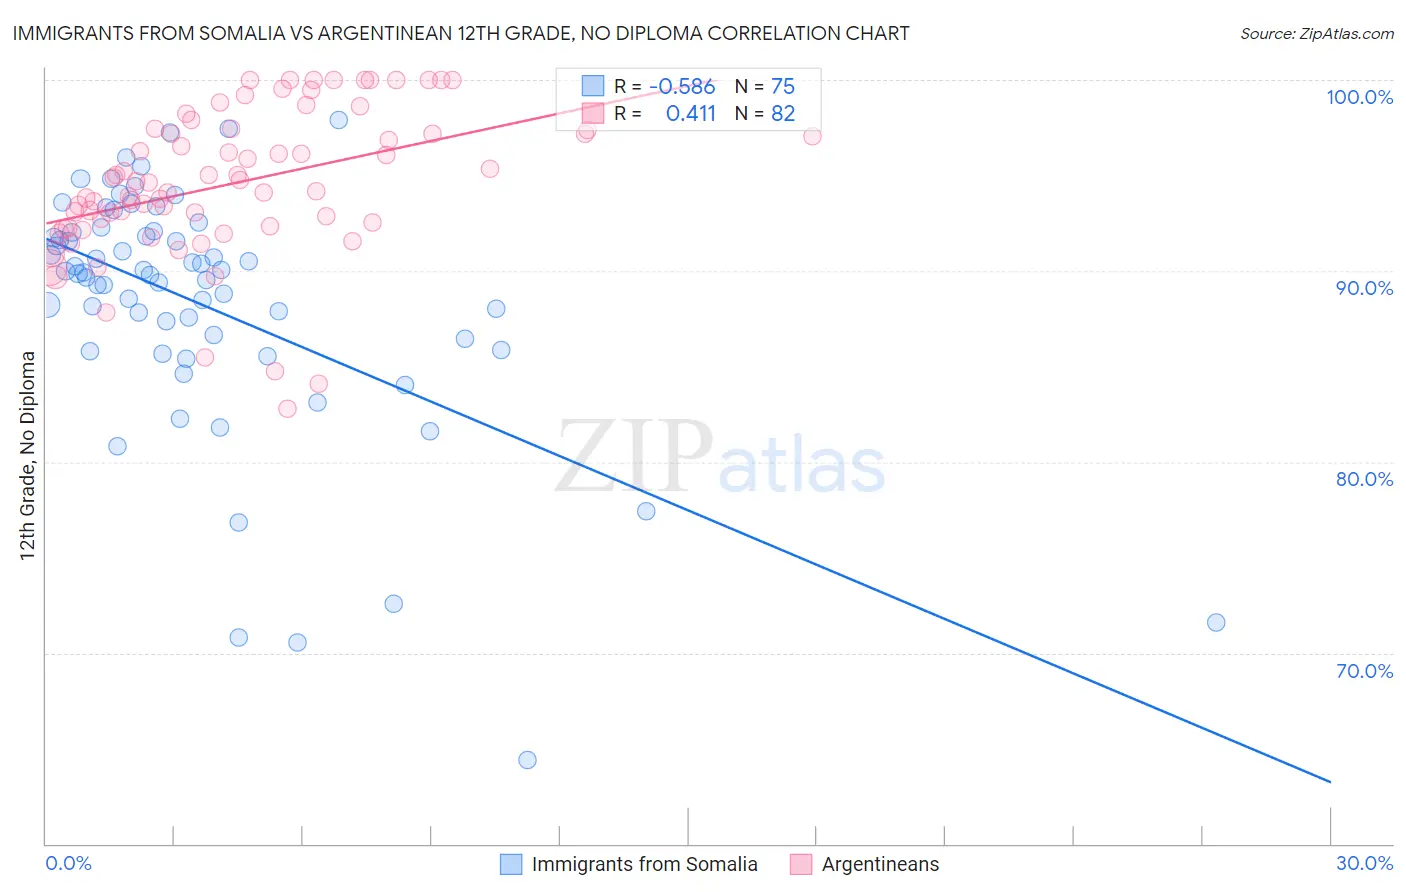
Immigrants from Somalia vs Argentinean 12th Grade, No Diploma Correlation Chart
The statistical analysis conducted on geographies consisting of 92,101,093 people shows a substantial negative correlation between the proportion of Immigrants from Somalia and percentage of population with at least 12th grade (no diploma) education in the United States with a correlation coefficient (R) of -0.586 and weighted average of 90.4%. Similarly, the statistical analysis conducted on geographies consisting of 297,143,432 people shows a moderate positive correlation between the proportion of Argentineans and percentage of population with at least 12th grade (no diploma) education in the United States with a correlation coefficient (R) of 0.411 and weighted average of 91.6%, a difference of 1.4%.
12th Grade, No Diploma Correlation Summary
| Measurement | Immigrants from Somalia | Argentinean |
| Minimum | 64.4% | 82.8% |
| Maximum | 97.9% | 100.0% |
| Range | 33.5% | 17.2% |
| Mean | 88.2% | 94.6% |
| Median | 89.8% | 94.7% |
| Interquartile 25% (IQ1) | 85.9% | 92.3% |
| Interquartile 75% (IQ3) | 92.0% | 97.4% |
| Interquartile Range (IQR) | 6.2% | 5.1% |
| Standard Deviation (Sample) | 6.5% | 3.9% |
| Standard Deviation (Population) | 6.5% | 3.8% |
Similar Demographics by 12th Grade, No Diploma
Demographics Similar to Immigrants from Somalia by 12th Grade, No Diploma
In terms of 12th grade, no diploma, the demographic groups most similar to Immigrants from Somalia are Immigrants from Liberia (90.4%, a difference of 0.020%), South American (90.3%, a difference of 0.020%), Immigrants from Panama (90.3%, a difference of 0.030%), Chickasaw (90.3%, a difference of 0.030%), and Immigrants from Zaire (90.3%, a difference of 0.040%).
| Demographics | Rating | Rank | 12th Grade, No Diploma |
| Arapaho | 7.7 /100 | #215 | Tragic 90.5% |
| Shoshone | 7.5 /100 | #216 | Tragic 90.5% |
| Cherokee | 7.4 /100 | #217 | Tragic 90.5% |
| Immigrants | Cameroon | 7.4 /100 | #218 | Tragic 90.5% |
| Uruguayans | 7.0 /100 | #219 | Tragic 90.4% |
| Colombians | 6.6 /100 | #220 | Tragic 90.4% |
| Immigrants | Liberia | 5.7 /100 | #221 | Tragic 90.4% |
| Immigrants | Somalia | 5.3 /100 | #222 | Tragic 90.4% |
| South Americans | 5.0 /100 | #223 | Tragic 90.3% |
| Immigrants | Panama | 4.8 /100 | #224 | Tragic 90.3% |
| Chickasaw | 4.8 /100 | #225 | Tragic 90.3% |
| Immigrants | Zaire | 4.6 /100 | #226 | Tragic 90.3% |
| Nigerians | 4.5 /100 | #227 | Tragic 90.3% |
| Creek | 3.9 /100 | #228 | Tragic 90.3% |
| Immigrants | Bahamas | 3.6 /100 | #229 | Tragic 90.2% |
Demographics Similar to Argentineans by 12th Grade, No Diploma
In terms of 12th grade, no diploma, the demographic groups most similar to Argentineans are Immigrants from Poland (91.6%, a difference of 0.010%), Immigrants from Venezuela (91.6%, a difference of 0.020%), Immigrants from Argentina (91.6%, a difference of 0.030%), Immigrants from Egypt (91.6%, a difference of 0.040%), and Immigrants from Spain (91.6%, a difference of 0.040%).
| Demographics | Rating | Rank | 12th Grade, No Diploma |
| Venezuelans | 88.2 /100 | #134 | Excellent 91.7% |
| Immigrants | Bosnia and Herzegovina | 87.3 /100 | #135 | Excellent 91.7% |
| Chileans | 85.8 /100 | #136 | Excellent 91.7% |
| Alaska Natives | 84.9 /100 | #137 | Excellent 91.6% |
| Arabs | 84.1 /100 | #138 | Excellent 91.6% |
| Immigrants | Egypt | 83.9 /100 | #139 | Excellent 91.6% |
| Immigrants | Poland | 82.3 /100 | #140 | Excellent 91.6% |
| Argentineans | 82.0 /100 | #141 | Excellent 91.6% |
| Immigrants | Venezuela | 80.9 /100 | #142 | Excellent 91.6% |
| Immigrants | Argentina | 80.7 /100 | #143 | Excellent 91.6% |
| Immigrants | Spain | 80.1 /100 | #144 | Excellent 91.6% |
| Immigrants | Lebanon | 80.0 /100 | #145 | Excellent 91.6% |
| Immigrants | Brazil | 79.8 /100 | #146 | Good 91.5% |
| Pakistanis | 79.6 /100 | #147 | Good 91.5% |
| Indians (Asian) | 79.4 /100 | #148 | Good 91.5% |