Italian vs Argentinean In Labor Force | Age 20-64
COMPARE
Italian
Argentinean
In Labor Force | Age 20-64
In Labor Force | Age 20-64 Comparison
Italians
Argentineans
79.9%
IN LABOR FORCE | AGE 20-64
88.9/ 100
METRIC RATING
129th/ 347
METRIC RANK
80.0%
IN LABOR FORCE | AGE 20-64
93.8/ 100
METRIC RATING
114th/ 347
METRIC RANK
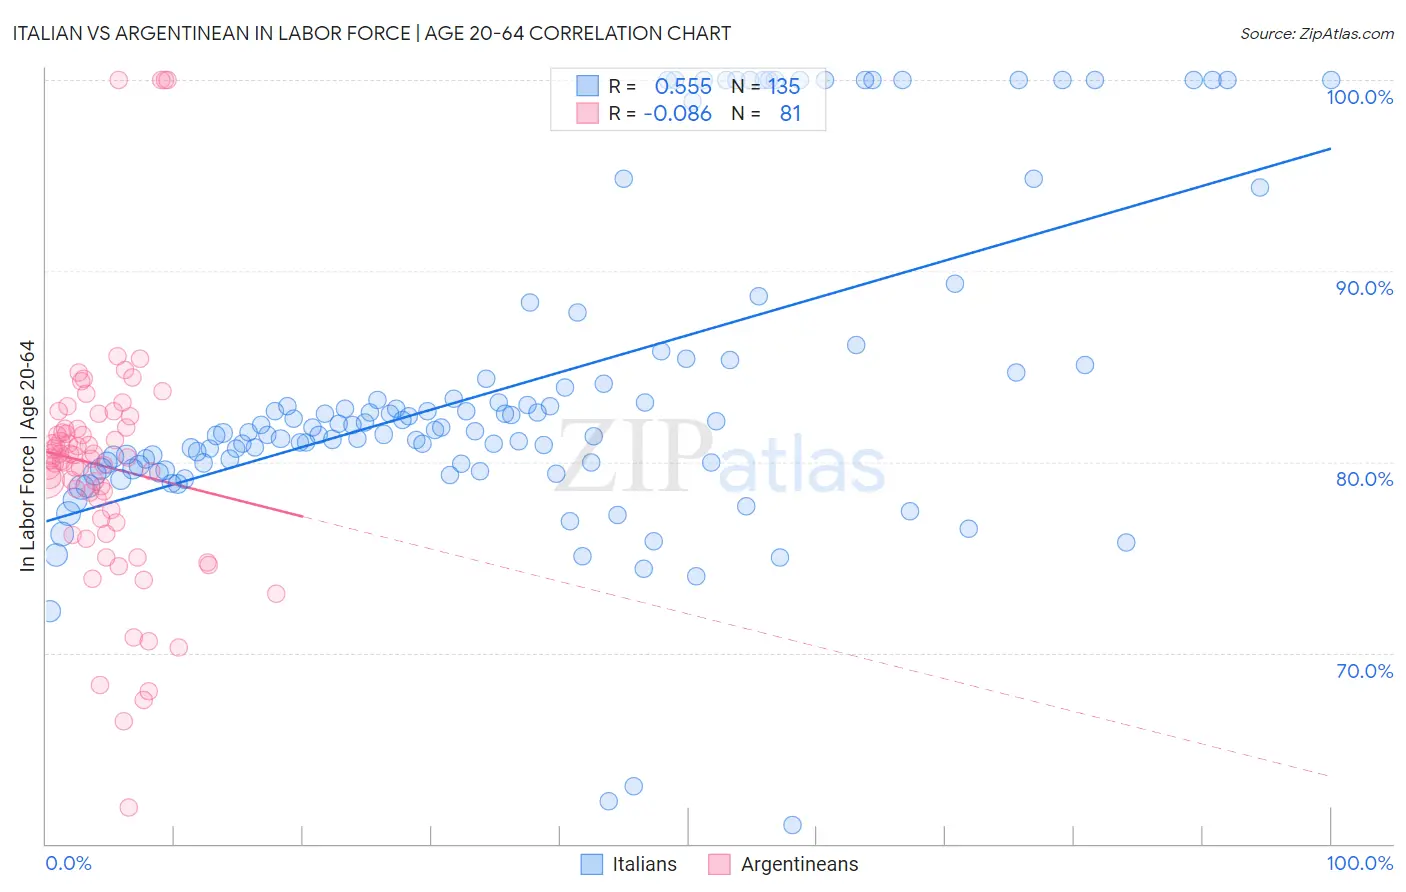
Italian vs Argentinean In Labor Force | Age 20-64 Correlation Chart
The statistical analysis conducted on geographies consisting of 575,104,388 people shows a substantial positive correlation between the proportion of Italians and labor force participation rate among population between the ages 20 and 64 in the United States with a correlation coefficient (R) of 0.555 and weighted average of 79.9%. Similarly, the statistical analysis conducted on geographies consisting of 297,148,532 people shows a slight negative correlation between the proportion of Argentineans and labor force participation rate among population between the ages 20 and 64 in the United States with a correlation coefficient (R) of -0.086 and weighted average of 80.0%, a difference of 0.13%.
In Labor Force | Age 20-64 Correlation Summary
| Measurement | Italian | Argentinean |
| Minimum | 61.0% | 61.9% |
| Maximum | 100.0% | 100.0% |
| Range | 39.0% | 38.1% |
| Mean | 83.9% | 79.8% |
| Median | 81.6% | 80.2% |
| Interquartile 25% (IQ1) | 79.8% | 76.9% |
| Interquartile 75% (IQ3) | 85.1% | 81.8% |
| Interquartile Range (IQR) | 5.3% | 4.9% |
| Standard Deviation (Sample) | 8.3% | 6.5% |
| Standard Deviation (Population) | 8.3% | 6.5% |
Demographics Similar to Italians and Argentineans by In Labor Force | Age 20-64
In terms of in labor force | age 20-64, the demographic groups most similar to Italians are Immigrants from Eastern Asia (79.9%, a difference of 0.010%), Immigrants from Zaire (79.9%, a difference of 0.010%), Immigrants from Iran (79.9%, a difference of 0.010%), Immigrants from Czechoslovakia (79.9%, a difference of 0.020%), and Immigrants from France (79.9%, a difference of 0.040%). Similarly, the demographic groups most similar to Argentineans are Immigrants from Italy (80.0%, a difference of 0.0%), Sri Lankan (80.0%, a difference of 0.0%), Immigrants from South America (80.0%, a difference of 0.010%), Bermudan (80.0%, a difference of 0.020%), and Immigrants from Western Africa (80.0%, a difference of 0.020%).
| Demographics | Rating | Rank | In Labor Force | Age 20-64 |
| Immigrants | South America | 93.9 /100 | #111 | Exceptional 80.0% |
| Immigrants | Italy | 93.9 /100 | #112 | Exceptional 80.0% |
| Sri Lankans | 93.9 /100 | #113 | Exceptional 80.0% |
| Argentineans | 93.8 /100 | #114 | Exceptional 80.0% |
| Bermudans | 93.3 /100 | #115 | Exceptional 80.0% |
| Immigrants | Western Africa | 93.1 /100 | #116 | Exceptional 80.0% |
| Immigrants | Vietnam | 92.7 /100 | #117 | Exceptional 80.0% |
| Cape Verdeans | 92.7 /100 | #118 | Exceptional 80.0% |
| Immigrants | Taiwan | 92.5 /100 | #119 | Exceptional 80.0% |
| Maltese | 92.4 /100 | #120 | Exceptional 80.0% |
| Immigrants | Kuwait | 92.2 /100 | #121 | Exceptional 80.0% |
| Mongolians | 92.0 /100 | #122 | Exceptional 79.9% |
| Immigrants | Russia | 91.8 /100 | #123 | Exceptional 79.9% |
| Immigrants | Europe | 91.6 /100 | #124 | Exceptional 79.9% |
| Danes | 91.5 /100 | #125 | Exceptional 79.9% |
| Immigrants | France | 90.7 /100 | #126 | Exceptional 79.9% |
| Immigrants | Czechoslovakia | 89.7 /100 | #127 | Excellent 79.9% |
| Immigrants | Eastern Asia | 89.4 /100 | #128 | Excellent 79.9% |
| Italians | 88.9 /100 | #129 | Excellent 79.9% |
| Immigrants | Zaire | 88.6 /100 | #130 | Excellent 79.9% |
| Immigrants | Iran | 88.3 /100 | #131 | Excellent 79.9% |