Immigrants from Singapore vs Tongan No Vehicles in Household
COMPARE
Immigrants from Singapore
Tongan
No Vehicles in Household
No Vehicles in Household Comparison
Immigrants from Singapore
Tongans
12.9%
NO VEHICLES IN HOUSEHOLD
0.1/ 100
METRIC RATING
274th/ 347
METRIC RANK
7.2%
NO VEHICLES IN HOUSEHOLD
100.0/ 100
METRIC RATING
18th/ 347
METRIC RANK
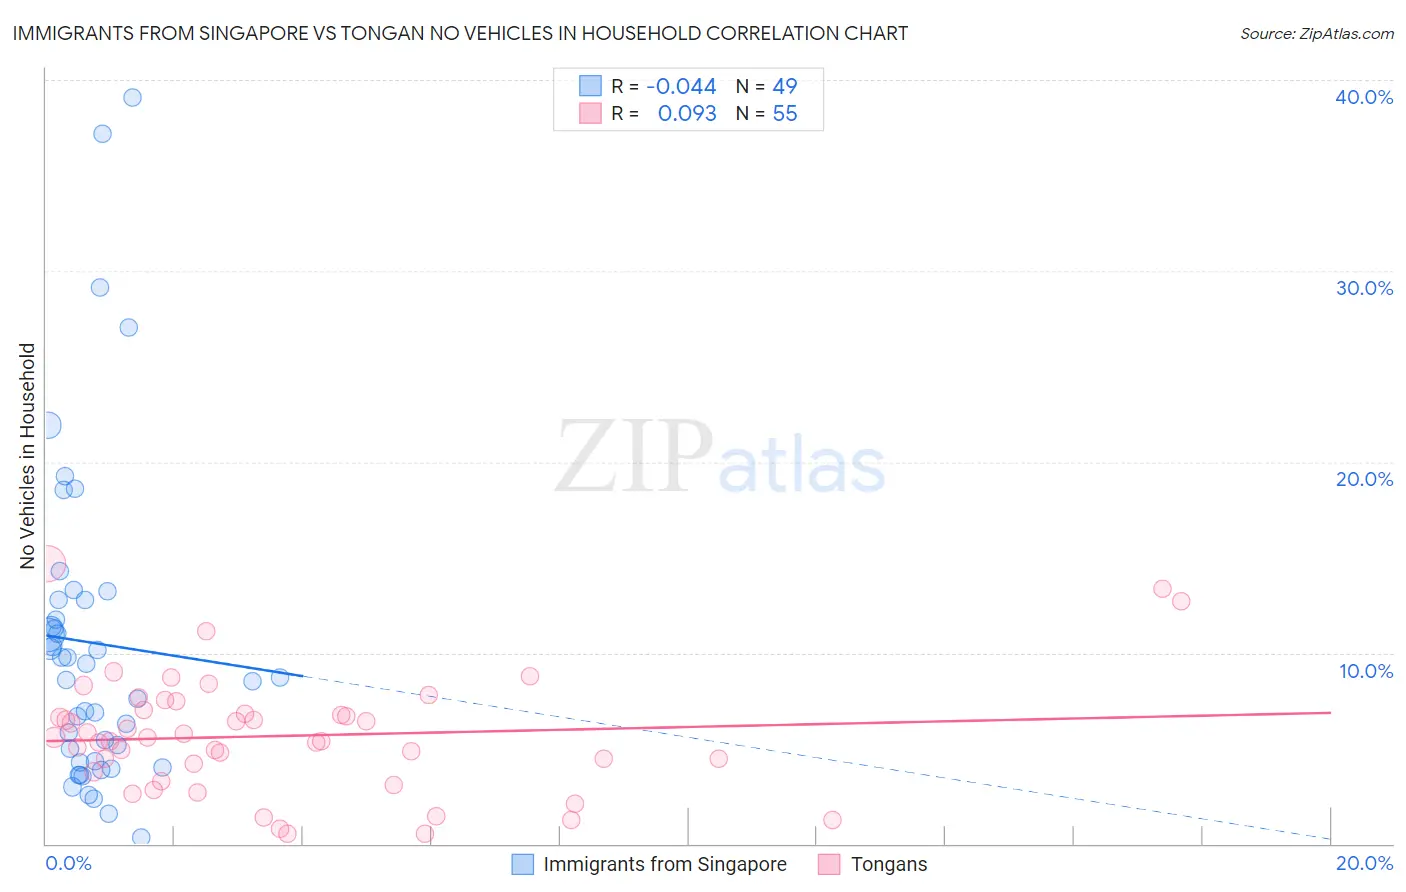
Immigrants from Singapore vs Tongan No Vehicles in Household Correlation Chart
The statistical analysis conducted on geographies consisting of 137,399,438 people shows no correlation between the proportion of Immigrants from Singapore and percentage of households with no vehicle available in the United States with a correlation coefficient (R) of -0.044 and weighted average of 12.9%. Similarly, the statistical analysis conducted on geographies consisting of 102,807,685 people shows a slight positive correlation between the proportion of Tongans and percentage of households with no vehicle available in the United States with a correlation coefficient (R) of 0.093 and weighted average of 7.2%, a difference of 80.5%.
No Vehicles in Household Correlation Summary
| Measurement | Immigrants from Singapore | Tongan |
| Minimum | 0.35% | 0.49% |
| Maximum | 39.1% | 14.6% |
| Range | 38.7% | 14.1% |
| Mean | 10.5% | 5.7% |
| Median | 8.7% | 5.5% |
| Interquartile 25% (IQ1) | 4.3% | 3.8% |
| Interquartile 75% (IQ3) | 12.8% | 7.0% |
| Interquartile Range (IQR) | 8.5% | 3.2% |
| Standard Deviation (Sample) | 8.5% | 3.1% |
| Standard Deviation (Population) | 8.4% | 3.0% |
Similar Demographics by No Vehicles in Household
Demographics Similar to Immigrants from Singapore by No Vehicles in Household
In terms of no vehicles in household, the demographic groups most similar to Immigrants from Singapore are Immigrants from France (12.9%, a difference of 0.040%), Immigrants from Albania (13.0%, a difference of 0.18%), Immigrants from Southern Europe (13.0%, a difference of 0.54%), Aleut (13.0%, a difference of 0.62%), and Immigrants from Croatia (13.0%, a difference of 0.66%).
| Demographics | Rating | Rank | No Vehicles in Household |
| Immigrants | Europe | 0.3 /100 | #267 | Tragic 12.5% |
| Immigrants | Africa | 0.2 /100 | #268 | Tragic 12.5% |
| Panamanians | 0.2 /100 | #269 | Tragic 12.5% |
| Immigrants | Northern Africa | 0.2 /100 | #270 | Tragic 12.6% |
| Immigrants | Morocco | 0.2 /100 | #271 | Tragic 12.6% |
| Bermudans | 0.1 /100 | #272 | Tragic 12.8% |
| Immigrants | France | 0.1 /100 | #273 | Tragic 12.9% |
| Immigrants | Singapore | 0.1 /100 | #274 | Tragic 12.9% |
| Immigrants | Albania | 0.1 /100 | #275 | Tragic 13.0% |
| Immigrants | Southern Europe | 0.1 /100 | #276 | Tragic 13.0% |
| Aleuts | 0.1 /100 | #277 | Tragic 13.0% |
| Immigrants | Croatia | 0.1 /100 | #278 | Tragic 13.0% |
| Mongolians | 0.0 /100 | #279 | Tragic 13.1% |
| Alsatians | 0.0 /100 | #280 | Tragic 13.2% |
| Central American Indians | 0.0 /100 | #281 | Tragic 13.3% |
Demographics Similar to Tongans by No Vehicles in Household
In terms of no vehicles in household, the demographic groups most similar to Tongans are Welsh (7.2%, a difference of 0.21%), European (7.1%, a difference of 0.78%), White/Caucasian (7.0%, a difference of 1.9%), Mexican (7.0%, a difference of 2.1%), and Scandinavian (7.0%, a difference of 2.2%).
| Demographics | Rating | Rank | No Vehicles in Household |
| Czechs | 100.0 /100 | #11 | Exceptional 6.9% |
| Assyrians/Chaldeans/Syriacs | 100.0 /100 | #12 | Exceptional 7.0% |
| Scandinavians | 100.0 /100 | #13 | Exceptional 7.0% |
| Mexicans | 100.0 /100 | #14 | Exceptional 7.0% |
| Whites/Caucasians | 100.0 /100 | #15 | Exceptional 7.0% |
| Europeans | 100.0 /100 | #16 | Exceptional 7.1% |
| Welsh | 100.0 /100 | #17 | Exceptional 7.2% |
| Tongans | 100.0 /100 | #18 | Exceptional 7.2% |
| Arapaho | 100.0 /100 | #19 | Exceptional 7.4% |
| Ottawa | 100.0 /100 | #20 | Exceptional 7.4% |
| Nepalese | 100.0 /100 | #21 | Exceptional 7.4% |
| Irish | 100.0 /100 | #22 | Exceptional 7.4% |
| French | 100.0 /100 | #23 | Exceptional 7.4% |
| Immigrants | Iraq | 100.0 /100 | #24 | Exceptional 7.5% |
| Yaqui | 100.0 /100 | #25 | Exceptional 7.5% |