Immigrants from Singapore vs Nepalese In Labor Force | Age > 16
COMPARE
Immigrants from Singapore
Nepalese
In Labor Force | Age > 16
In Labor Force | Age > 16 Comparison
Immigrants from Singapore
Nepalese
66.2%
IN LABOR FORCE | AGE > 16
99.7/ 100
METRIC RATING
75th/ 347
METRIC RANK
63.8%
IN LABOR FORCE | AGE > 16
0.1/ 100
METRIC RATING
291st/ 347
METRIC RANK
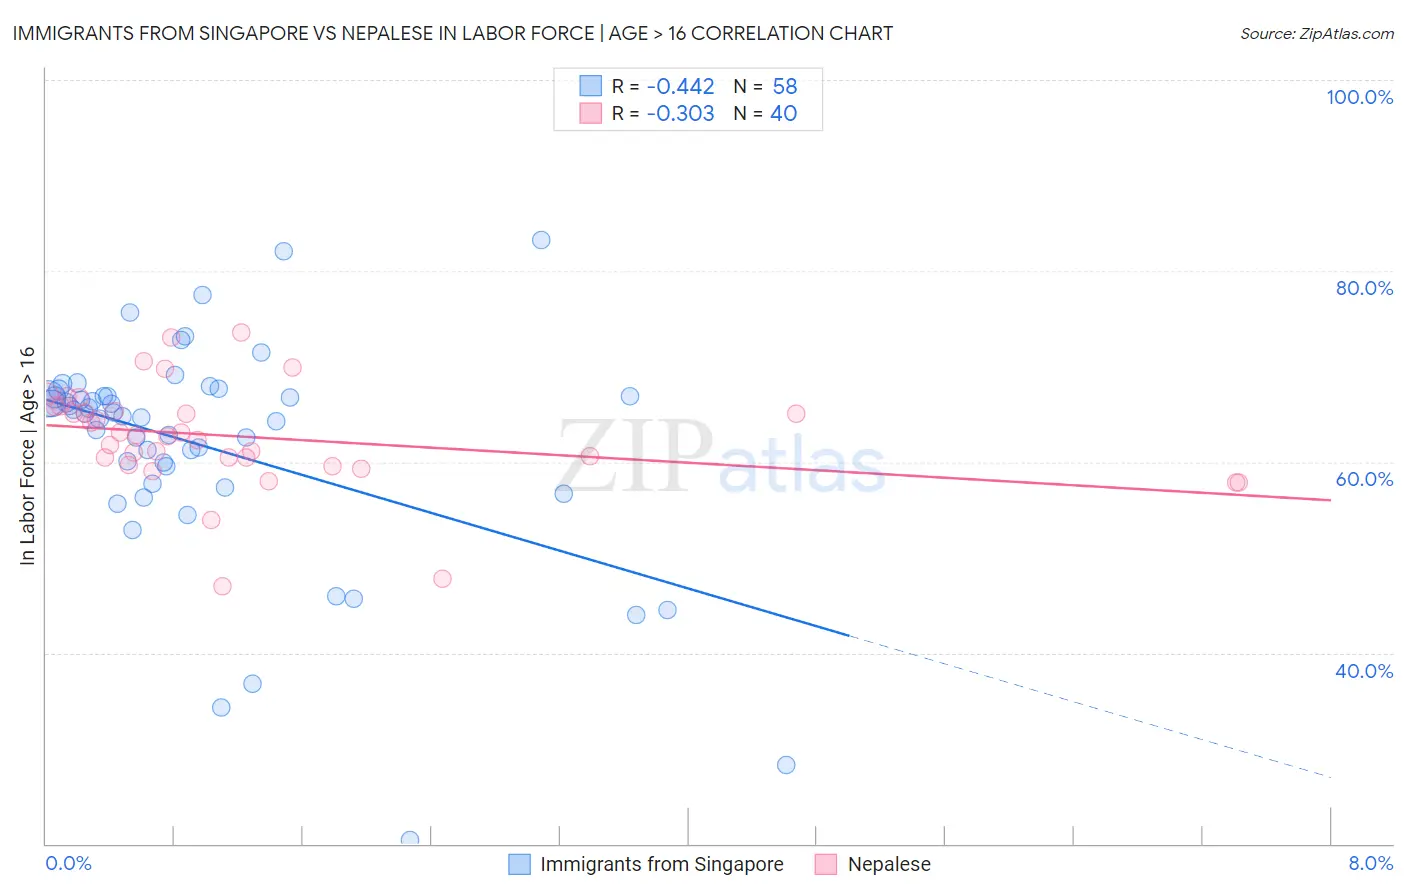
Immigrants from Singapore vs Nepalese In Labor Force | Age > 16 Correlation Chart
The statistical analysis conducted on geographies consisting of 137,522,009 people shows a moderate negative correlation between the proportion of Immigrants from Singapore and labor force participation rate among population ages 16 and over in the United States with a correlation coefficient (R) of -0.442 and weighted average of 66.2%. Similarly, the statistical analysis conducted on geographies consisting of 24,521,755 people shows a mild negative correlation between the proportion of Nepalese and labor force participation rate among population ages 16 and over in the United States with a correlation coefficient (R) of -0.303 and weighted average of 63.8%, a difference of 3.7%.
In Labor Force | Age > 16 Correlation Summary
| Measurement | Immigrants from Singapore | Nepalese |
| Minimum | 20.4% | 47.0% |
| Maximum | 83.2% | 73.5% |
| Range | 62.8% | 26.5% |
| Mean | 61.5% | 62.6% |
| Median | 64.9% | 62.7% |
| Interquartile 25% (IQ1) | 57.8% | 60.0% |
| Interquartile 75% (IQ3) | 66.9% | 65.6% |
| Interquartile Range (IQR) | 9.1% | 5.5% |
| Standard Deviation (Sample) | 11.7% | 5.5% |
| Standard Deviation (Population) | 11.6% | 5.4% |
Similar Demographics by In Labor Force | Age > 16
Demographics Similar to Immigrants from Singapore by In Labor Force | Age > 16
In terms of in labor force | age > 16, the demographic groups most similar to Immigrants from Singapore are Immigrants from Vietnam (66.2%, a difference of 0.010%), Immigrants from Korea (66.2%, a difference of 0.010%), Burmese (66.2%, a difference of 0.020%), Taiwanese (66.2%, a difference of 0.020%), and Asian (66.2%, a difference of 0.040%).
| Demographics | Rating | Rank | In Labor Force | Age > 16 |
| Immigrants | Egypt | 99.7 /100 | #68 | Exceptional 66.2% |
| Sub-Saharan Africans | 99.7 /100 | #69 | Exceptional 66.2% |
| Asians | 99.7 /100 | #70 | Exceptional 66.2% |
| Burmese | 99.7 /100 | #71 | Exceptional 66.2% |
| Taiwanese | 99.7 /100 | #72 | Exceptional 66.2% |
| Immigrants | Vietnam | 99.7 /100 | #73 | Exceptional 66.2% |
| Immigrants | Korea | 99.7 /100 | #74 | Exceptional 66.2% |
| Immigrants | Singapore | 99.7 /100 | #75 | Exceptional 66.2% |
| Immigrants | Malaysia | 99.6 /100 | #76 | Exceptional 66.1% |
| Immigrants | Moldova | 99.6 /100 | #77 | Exceptional 66.1% |
| Immigrants | Asia | 99.6 /100 | #78 | Exceptional 66.1% |
| Turks | 99.6 /100 | #79 | Exceptional 66.1% |
| Malaysians | 99.6 /100 | #80 | Exceptional 66.1% |
| Moroccans | 99.5 /100 | #81 | Exceptional 66.1% |
| German Russians | 99.4 /100 | #82 | Exceptional 66.1% |
Demographics Similar to Nepalese by In Labor Force | Age > 16
In terms of in labor force | age > 16, the demographic groups most similar to Nepalese are Hungarian (63.8%, a difference of 0.010%), Celtic (63.8%, a difference of 0.040%), Spanish American Indian (63.8%, a difference of 0.060%), Spanish (63.9%, a difference of 0.070%), and English (63.7%, a difference of 0.10%).
| Demographics | Rating | Rank | In Labor Force | Age > 16 |
| French | 0.1 /100 | #284 | Tragic 63.9% |
| Slovaks | 0.1 /100 | #285 | Tragic 63.9% |
| Immigrants | Austria | 0.1 /100 | #286 | Tragic 63.9% |
| Scottish | 0.1 /100 | #287 | Tragic 63.9% |
| Spanish | 0.1 /100 | #288 | Tragic 63.9% |
| Celtics | 0.1 /100 | #289 | Tragic 63.8% |
| Hungarians | 0.1 /100 | #290 | Tragic 63.8% |
| Nepalese | 0.1 /100 | #291 | Tragic 63.8% |
| Spanish American Indians | 0.1 /100 | #292 | Tragic 63.8% |
| English | 0.1 /100 | #293 | Tragic 63.7% |
| Puget Sound Salish | 0.0 /100 | #294 | Tragic 63.7% |
| Immigrants | Canada | 0.0 /100 | #295 | Tragic 63.7% |
| Immigrants | North America | 0.0 /100 | #296 | Tragic 63.7% |
| Immigrants | Grenada | 0.0 /100 | #297 | Tragic 63.6% |
| Comanche | 0.0 /100 | #298 | Tragic 63.6% |