English vs Immigrants from Dominica In Labor Force | Age > 16
COMPARE
English
Immigrants from Dominica
In Labor Force | Age > 16
In Labor Force | Age > 16 Comparison
English
Immigrants from Dominica
63.7%
IN LABOR FORCE | AGE > 16
0.1/ 100
METRIC RATING
293rd/ 347
METRIC RANK
64.5%
IN LABOR FORCE | AGE > 16
3.5/ 100
METRIC RATING
241st/ 347
METRIC RANK
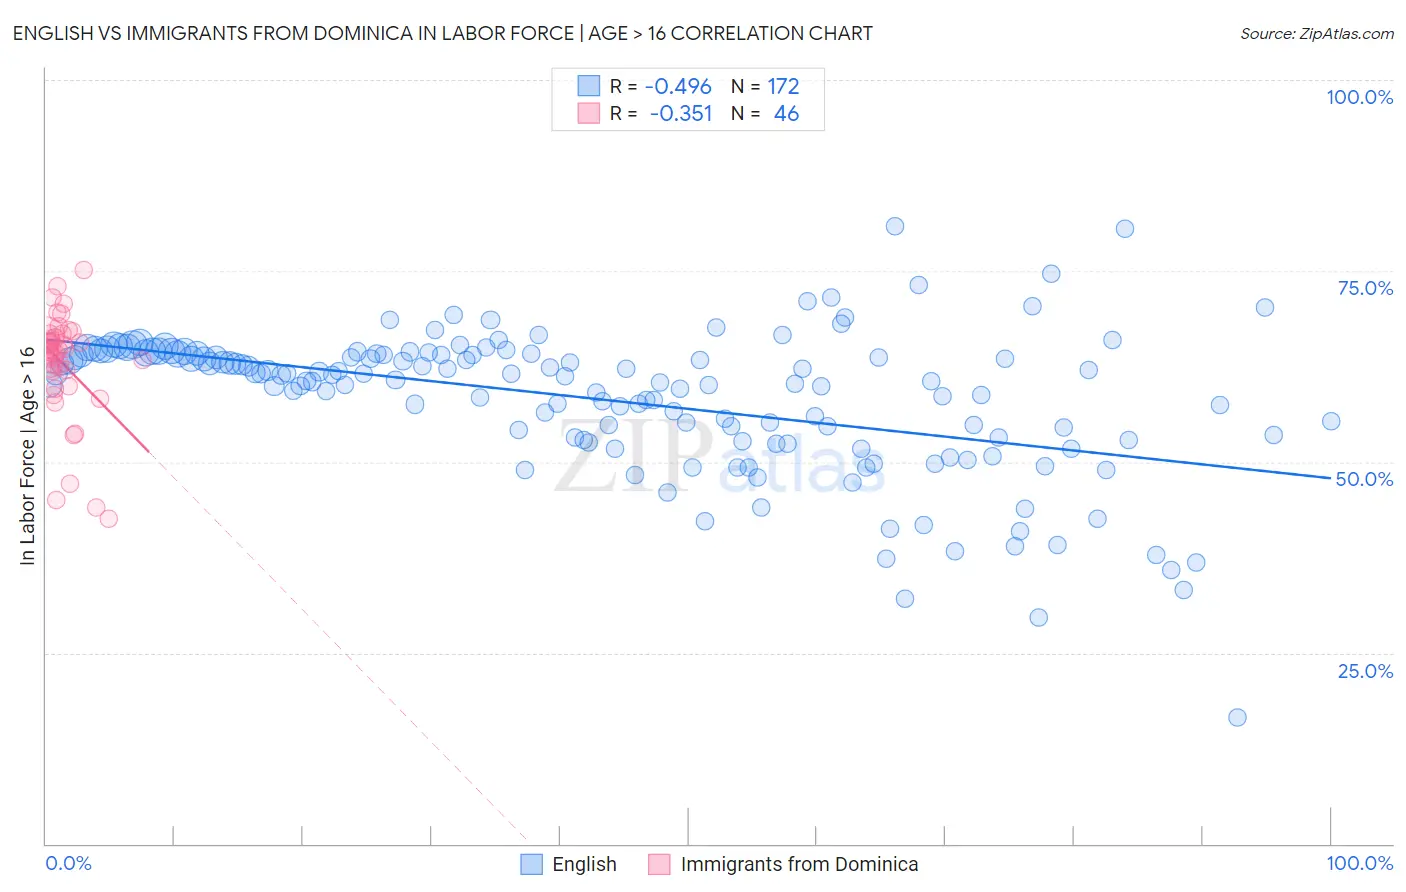
English vs Immigrants from Dominica In Labor Force | Age > 16 Correlation Chart
The statistical analysis conducted on geographies consisting of 579,971,917 people shows a moderate negative correlation between the proportion of English and labor force participation rate among population ages 16 and over in the United States with a correlation coefficient (R) of -0.496 and weighted average of 63.7%. Similarly, the statistical analysis conducted on geographies consisting of 83,796,433 people shows a mild negative correlation between the proportion of Immigrants from Dominica and labor force participation rate among population ages 16 and over in the United States with a correlation coefficient (R) of -0.351 and weighted average of 64.5%, a difference of 1.2%.
In Labor Force | Age > 16 Correlation Summary
| Measurement | English | Immigrants from Dominica |
| Minimum | 16.6% | 42.6% |
| Maximum | 80.8% | 75.1% |
| Range | 64.2% | 32.5% |
| Mean | 58.1% | 62.8% |
| Median | 61.0% | 64.7% |
| Interquartile 25% (IQ1) | 53.1% | 62.0% |
| Interquartile 75% (IQ3) | 64.1% | 66.6% |
| Interquartile Range (IQR) | 11.1% | 4.6% |
| Standard Deviation (Sample) | 9.5% | 7.1% |
| Standard Deviation (Population) | 9.5% | 7.0% |
Similar Demographics by In Labor Force | Age > 16
Demographics Similar to English by In Labor Force | Age > 16
In terms of in labor force | age > 16, the demographic groups most similar to English are Puget Sound Salish (63.7%, a difference of 0.030%), Spanish American Indian (63.8%, a difference of 0.040%), Immigrants from Canada (63.7%, a difference of 0.080%), Nepalese (63.8%, a difference of 0.10%), and Immigrants from North America (63.7%, a difference of 0.10%).
| Demographics | Rating | Rank | In Labor Force | Age > 16 |
| Immigrants | Austria | 0.1 /100 | #286 | Tragic 63.9% |
| Scottish | 0.1 /100 | #287 | Tragic 63.9% |
| Spanish | 0.1 /100 | #288 | Tragic 63.9% |
| Celtics | 0.1 /100 | #289 | Tragic 63.8% |
| Hungarians | 0.1 /100 | #290 | Tragic 63.8% |
| Nepalese | 0.1 /100 | #291 | Tragic 63.8% |
| Spanish American Indians | 0.1 /100 | #292 | Tragic 63.8% |
| English | 0.1 /100 | #293 | Tragic 63.7% |
| Puget Sound Salish | 0.0 /100 | #294 | Tragic 63.7% |
| Immigrants | Canada | 0.0 /100 | #295 | Tragic 63.7% |
| Immigrants | North America | 0.0 /100 | #296 | Tragic 63.7% |
| Immigrants | Grenada | 0.0 /100 | #297 | Tragic 63.6% |
| Comanche | 0.0 /100 | #298 | Tragic 63.6% |
| Whites/Caucasians | 0.0 /100 | #299 | Tragic 63.6% |
| Immigrants | Azores | 0.0 /100 | #300 | Tragic 63.6% |
Demographics Similar to Immigrants from Dominica by In Labor Force | Age > 16
In terms of in labor force | age > 16, the demographic groups most similar to Immigrants from Dominica are Immigrants from Bangladesh (64.5%, a difference of 0.0%), Immigrants from Netherlands (64.5%, a difference of 0.010%), Immigrants from Hungary (64.5%, a difference of 0.020%), Lebanese (64.5%, a difference of 0.030%), and Immigrants from Lebanon (64.5%, a difference of 0.030%).
| Demographics | Rating | Rank | In Labor Force | Age > 16 |
| Vietnamese | 4.7 /100 | #234 | Tragic 64.6% |
| Austrians | 4.6 /100 | #235 | Tragic 64.6% |
| Immigrants | Norway | 4.6 /100 | #236 | Tragic 64.6% |
| Italians | 4.6 /100 | #237 | Tragic 64.6% |
| Lebanese | 3.9 /100 | #238 | Tragic 64.5% |
| Immigrants | Hungary | 3.8 /100 | #239 | Tragic 64.5% |
| Immigrants | Bangladesh | 3.6 /100 | #240 | Tragic 64.5% |
| Immigrants | Dominica | 3.5 /100 | #241 | Tragic 64.5% |
| Immigrants | Netherlands | 3.4 /100 | #242 | Tragic 64.5% |
| Immigrants | Lebanon | 3.2 /100 | #243 | Tragic 64.5% |
| Tsimshian | 3.1 /100 | #244 | Tragic 64.5% |
| West Indians | 3.0 /100 | #245 | Tragic 64.5% |
| Immigrants | Caribbean | 2.3 /100 | #246 | Tragic 64.4% |
| Swiss | 2.1 /100 | #247 | Tragic 64.4% |
| Immigrants | Barbados | 2.1 /100 | #248 | Tragic 64.4% |