Immigrants from Serbia vs African In Labor Force | Age 30-34
COMPARE
Immigrants from Serbia
African
In Labor Force | Age 30-34
In Labor Force | Age 30-34 Comparison
Immigrants from Serbia
Africans
86.2%
IN LABOR FORCE | AGE 30-34
100.0/ 100
METRIC RATING
10th/ 347
METRIC RANK
83.4%
IN LABOR FORCE | AGE 30-34
0.0/ 100
METRIC RATING
280th/ 347
METRIC RANK
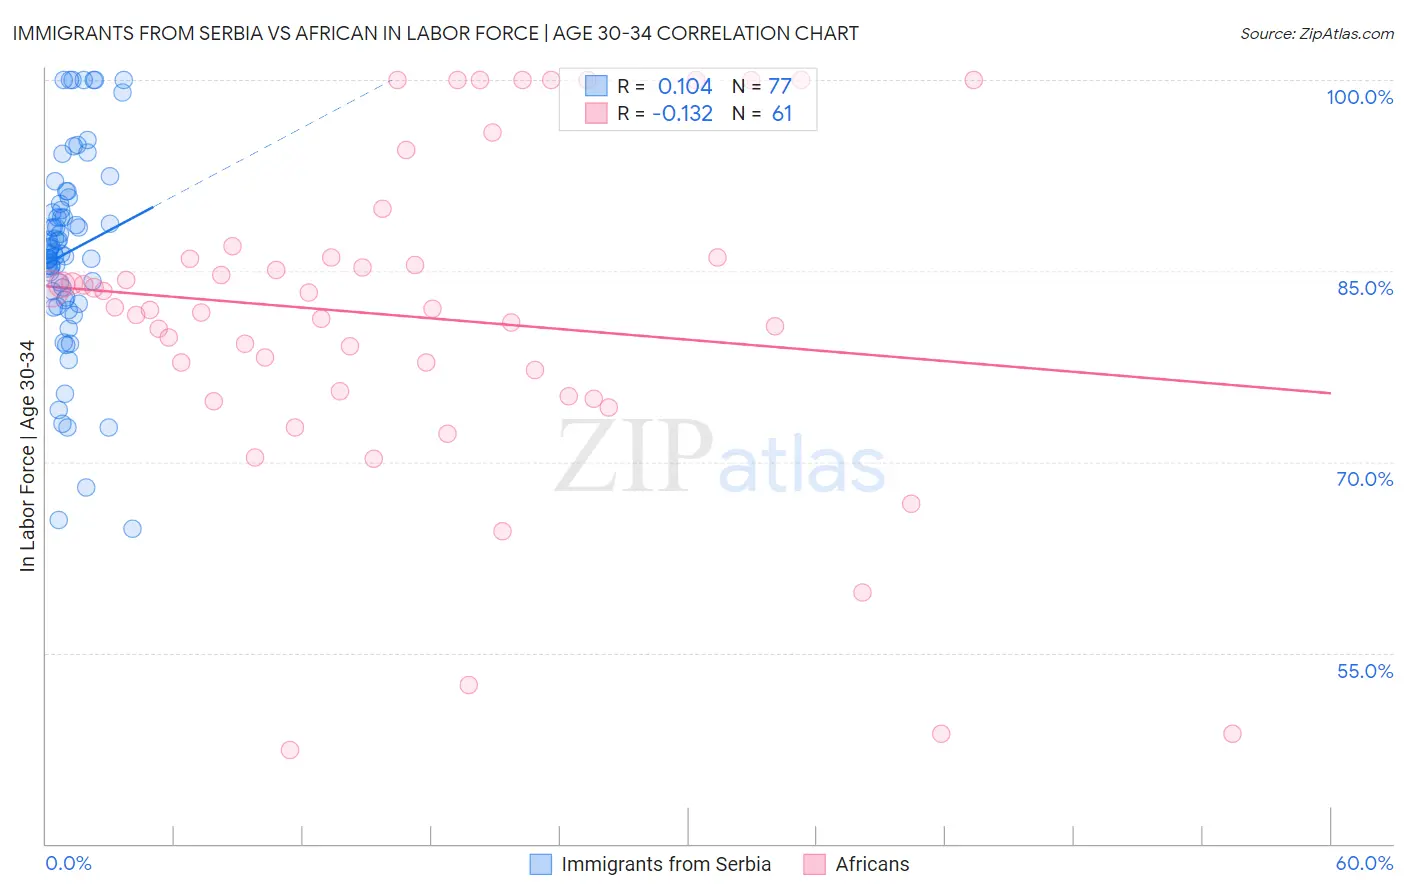
Immigrants from Serbia vs African In Labor Force | Age 30-34 Correlation Chart
The statistical analysis conducted on geographies consisting of 131,692,327 people shows a poor positive correlation between the proportion of Immigrants from Serbia and labor force participation rate among population between the ages 30 and 34 in the United States with a correlation coefficient (R) of 0.104 and weighted average of 86.2%. Similarly, the statistical analysis conducted on geographies consisting of 469,594,480 people shows a poor negative correlation between the proportion of Africans and labor force participation rate among population between the ages 30 and 34 in the United States with a correlation coefficient (R) of -0.132 and weighted average of 83.4%, a difference of 3.4%.
In Labor Force | Age 30-34 Correlation Summary
| Measurement | Immigrants from Serbia | African |
| Minimum | 64.7% | 47.4% |
| Maximum | 100.0% | 100.0% |
| Range | 35.3% | 52.6% |
| Mean | 86.5% | 81.4% |
| Median | 86.5% | 82.1% |
| Interquartile 25% (IQ1) | 82.8% | 75.4% |
| Interquartile 75% (IQ3) | 90.0% | 86.1% |
| Interquartile Range (IQR) | 7.2% | 10.7% |
| Standard Deviation (Sample) | 7.7% | 12.9% |
| Standard Deviation (Population) | 7.7% | 12.7% |
Similar Demographics by In Labor Force | Age 30-34
Demographics Similar to Immigrants from Serbia by In Labor Force | Age 30-34
In terms of in labor force | age 30-34, the demographic groups most similar to Immigrants from Serbia are Carpatho Rusyn (86.2%, a difference of 0.010%), Immigrants from Somalia (86.2%, a difference of 0.040%), Cambodian (86.2%, a difference of 0.050%), Immigrants from Bolivia (86.2%, a difference of 0.060%), and Somali (86.2%, a difference of 0.070%).
| Demographics | Rating | Rank | In Labor Force | Age 30-34 |
| Immigrants | Ethiopia | 100.0 /100 | #3 | Exceptional 86.6% |
| Liberians | 100.0 /100 | #4 | Exceptional 86.4% |
| Immigrants | Ireland | 100.0 /100 | #5 | Exceptional 86.3% |
| Somalis | 100.0 /100 | #6 | Exceptional 86.2% |
| Immigrants | Bolivia | 100.0 /100 | #7 | Exceptional 86.2% |
| Cambodians | 100.0 /100 | #8 | Exceptional 86.2% |
| Immigrants | Somalia | 100.0 /100 | #9 | Exceptional 86.2% |
| Immigrants | Serbia | 100.0 /100 | #10 | Exceptional 86.2% |
| Carpatho Rusyns | 100.0 /100 | #11 | Exceptional 86.2% |
| Bolivians | 100.0 /100 | #12 | Exceptional 86.1% |
| Immigrants | Croatia | 100.0 /100 | #13 | Exceptional 86.1% |
| Immigrants | Cabo Verde | 100.0 /100 | #14 | Exceptional 86.1% |
| Immigrants | Albania | 100.0 /100 | #15 | Exceptional 86.1% |
| Latvians | 100.0 /100 | #16 | Exceptional 86.0% |
| Immigrants | Cameroon | 100.0 /100 | #17 | Exceptional 86.0% |
Demographics Similar to Africans by In Labor Force | Age 30-34
In terms of in labor force | age 30-34, the demographic groups most similar to Africans are Immigrants from Fiji (83.4%, a difference of 0.030%), Fijian (83.4%, a difference of 0.040%), Delaware (83.5%, a difference of 0.10%), Immigrants from Grenada (83.5%, a difference of 0.12%), and Tongan (83.5%, a difference of 0.12%).
| Demographics | Rating | Rank | In Labor Force | Age 30-34 |
| Guamanians/Chamorros | 0.0 /100 | #273 | Tragic 83.5% |
| Belizeans | 0.0 /100 | #274 | Tragic 83.5% |
| Immigrants | Grenada | 0.0 /100 | #275 | Tragic 83.5% |
| Tongans | 0.0 /100 | #276 | Tragic 83.5% |
| Delaware | 0.0 /100 | #277 | Tragic 83.5% |
| Fijians | 0.0 /100 | #278 | Tragic 83.4% |
| Immigrants | Fiji | 0.0 /100 | #279 | Tragic 83.4% |
| Africans | 0.0 /100 | #280 | Tragic 83.4% |
| Samoans | 0.0 /100 | #281 | Tragic 83.3% |
| Mexican American Indians | 0.0 /100 | #282 | Tragic 83.2% |
| Assyrians/Chaldeans/Syriacs | 0.0 /100 | #283 | Tragic 83.2% |
| Immigrants | Belize | 0.0 /100 | #284 | Tragic 83.2% |
| Cree | 0.0 /100 | #285 | Tragic 83.2% |
| Immigrants | Latin America | 0.0 /100 | #286 | Tragic 83.1% |
| Native Hawaiians | 0.0 /100 | #287 | Tragic 83.0% |