Immigrants from Serbia vs Immigrants from Middle Africa In Labor Force | Age 16-19
COMPARE
Immigrants from Serbia
Immigrants from Middle Africa
In Labor Force | Age 16-19
In Labor Force | Age 16-19 Comparison
Immigrants from Serbia
Immigrants from Middle Africa
36.0%
IN LABOR FORCE | AGE 16-19
21.0/ 100
METRIC RATING
197th/ 347
METRIC RANK
39.9%
IN LABOR FORCE | AGE 16-19
99.9/ 100
METRIC RATING
73rd/ 347
METRIC RANK
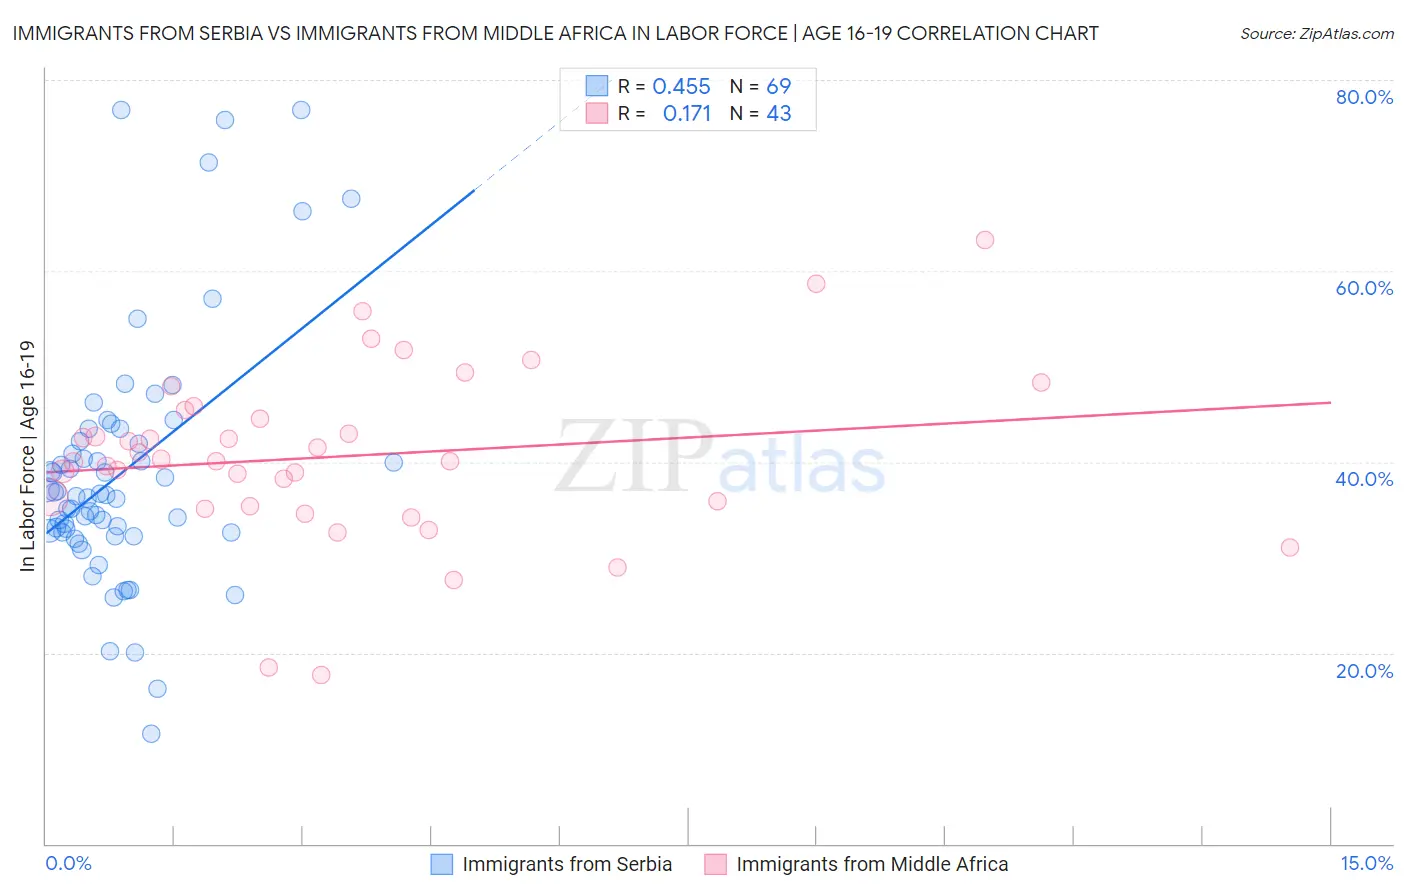
Immigrants from Serbia vs Immigrants from Middle Africa In Labor Force | Age 16-19 Correlation Chart
The statistical analysis conducted on geographies consisting of 131,679,358 people shows a moderate positive correlation between the proportion of Immigrants from Serbia and labor force participation rate among population between the ages 16 and 19 in the United States with a correlation coefficient (R) of 0.455 and weighted average of 36.0%. Similarly, the statistical analysis conducted on geographies consisting of 202,678,432 people shows a poor positive correlation between the proportion of Immigrants from Middle Africa and labor force participation rate among population between the ages 16 and 19 in the United States with a correlation coefficient (R) of 0.171 and weighted average of 39.9%, a difference of 11.1%.
In Labor Force | Age 16-19 Correlation Summary
| Measurement | Immigrants from Serbia | Immigrants from Middle Africa |
| Minimum | 11.5% | 17.7% |
| Maximum | 76.8% | 63.3% |
| Range | 65.3% | 45.6% |
| Mean | 39.0% | 40.6% |
| Median | 36.5% | 40.1% |
| Interquartile 25% (IQ1) | 32.6% | 35.3% |
| Interquartile 75% (IQ3) | 42.8% | 45.4% |
| Interquartile Range (IQR) | 10.2% | 10.1% |
| Standard Deviation (Sample) | 13.1% | 9.1% |
| Standard Deviation (Population) | 13.0% | 9.0% |
Similar Demographics by In Labor Force | Age 16-19
Demographics Similar to Immigrants from Serbia by In Labor Force | Age 16-19
In terms of in labor force | age 16-19, the demographic groups most similar to Immigrants from Serbia are Mexican American Indian (36.0%, a difference of 0.010%), Immigrants from Northern Africa (35.9%, a difference of 0.080%), Immigrants from Norway (35.9%, a difference of 0.090%), Bolivian (36.0%, a difference of 0.17%), and Immigrants from Sweden (35.9%, a difference of 0.17%).
| Demographics | Rating | Rank | In Labor Force | Age 16-19 |
| Panamanians | 28.6 /100 | #190 | Fair 36.1% |
| Immigrants | Croatia | 27.5 /100 | #191 | Fair 36.1% |
| Afghans | 25.7 /100 | #192 | Fair 36.1% |
| Immigrants | Denmark | 25.0 /100 | #193 | Fair 36.1% |
| Nigerians | 24.6 /100 | #194 | Fair 36.1% |
| Bolivians | 23.3 /100 | #195 | Fair 36.0% |
| Mexican American Indians | 21.1 /100 | #196 | Fair 36.0% |
| Immigrants | Serbia | 21.0 /100 | #197 | Fair 36.0% |
| Immigrants | Northern Africa | 19.9 /100 | #198 | Poor 35.9% |
| Immigrants | Norway | 19.8 /100 | #199 | Poor 35.9% |
| Immigrants | Sweden | 18.8 /100 | #200 | Poor 35.9% |
| Alsatians | 17.5 /100 | #201 | Poor 35.9% |
| Senegalese | 17.4 /100 | #202 | Poor 35.9% |
| Immigrants | Nigeria | 16.8 /100 | #203 | Poor 35.8% |
| Immigrants | Albania | 15.0 /100 | #204 | Poor 35.8% |
Demographics Similar to Immigrants from Middle Africa by In Labor Force | Age 16-19
In terms of in labor force | age 16-19, the demographic groups most similar to Immigrants from Middle Africa are Iroquois (39.9%, a difference of 0.030%), Serbian (39.9%, a difference of 0.040%), Portuguese (40.0%, a difference of 0.21%), Hungarian (39.8%, a difference of 0.23%), and French American Indian (39.8%, a difference of 0.25%).
| Demographics | Rating | Rank | In Labor Force | Age 16-19 |
| Immigrants | Nonimmigrants | 100.0 /100 | #66 | Exceptional 40.1% |
| Canadians | 100.0 /100 | #67 | Exceptional 40.1% |
| Italians | 99.9 /100 | #68 | Exceptional 40.1% |
| Potawatomi | 99.9 /100 | #69 | Exceptional 40.0% |
| Portuguese | 99.9 /100 | #70 | Exceptional 40.0% |
| Serbians | 99.9 /100 | #71 | Exceptional 39.9% |
| Iroquois | 99.9 /100 | #72 | Exceptional 39.9% |
| Immigrants | Middle Africa | 99.9 /100 | #73 | Exceptional 39.9% |
| Hungarians | 99.9 /100 | #74 | Exceptional 39.8% |
| French American Indians | 99.9 /100 | #75 | Exceptional 39.8% |
| Malaysians | 99.9 /100 | #76 | Exceptional 39.7% |
| Immigrants | Portugal | 99.9 /100 | #77 | Exceptional 39.7% |
| Austrians | 99.8 /100 | #78 | Exceptional 39.5% |
| Marshallese | 99.8 /100 | #79 | Exceptional 39.5% |
| Immigrants | Iraq | 99.8 /100 | #80 | Exceptional 39.4% |