Immigrants from Eastern Africa vs Inupiat In Labor Force | Age 30-34
COMPARE
Immigrants from Eastern Africa
Inupiat
In Labor Force | Age 30-34
In Labor Force | Age 30-34 Comparison
Immigrants from Eastern Africa
Inupiat
85.9%
IN LABOR FORCE | AGE 30-34
100.0/ 100
METRIC RATING
26th/ 347
METRIC RANK
79.7%
IN LABOR FORCE | AGE 30-34
0.0/ 100
METRIC RATING
333rd/ 347
METRIC RANK
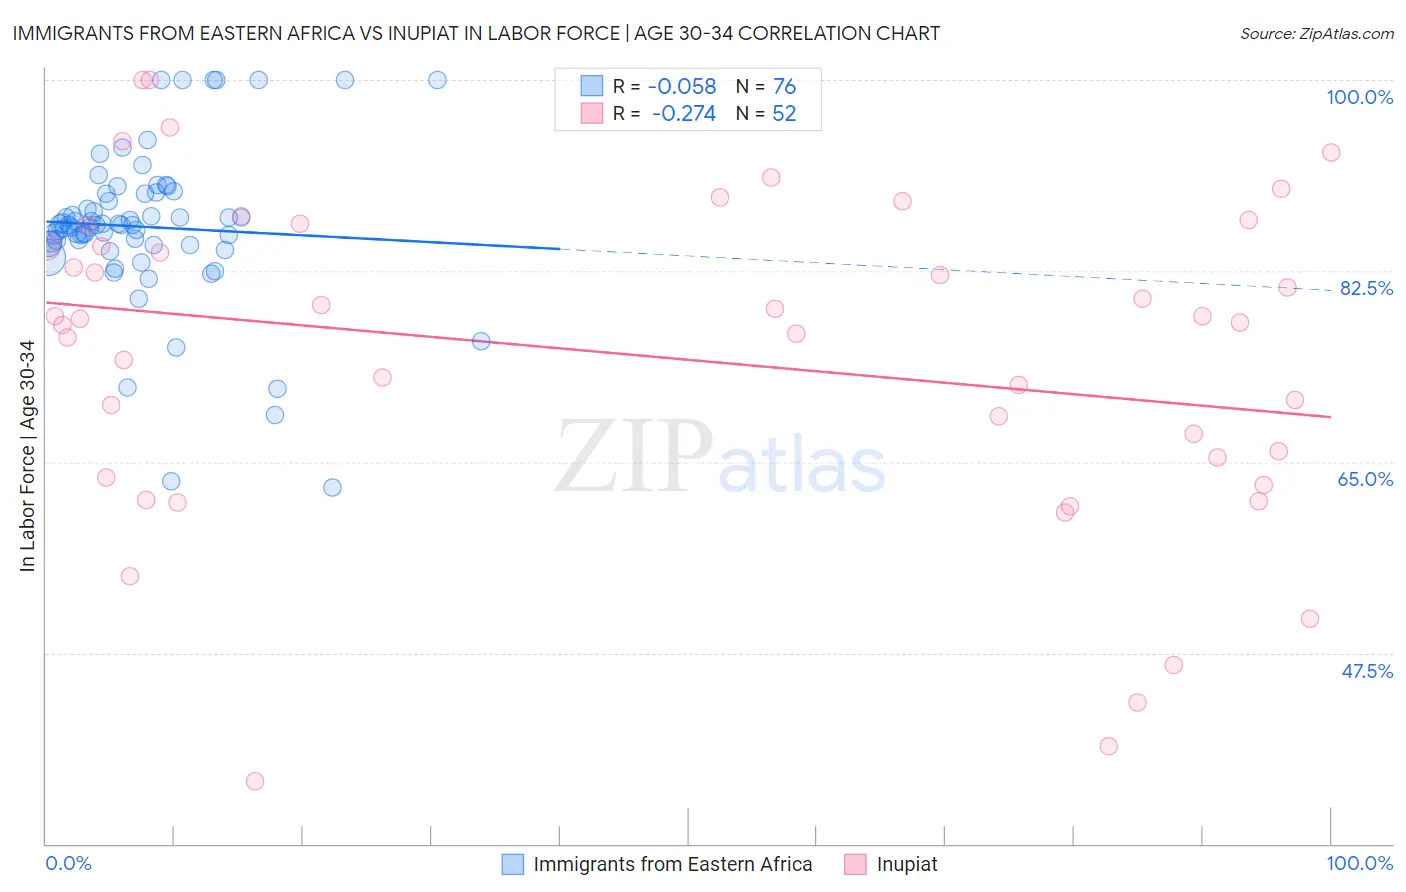
Immigrants from Eastern Africa vs Inupiat In Labor Force | Age 30-34 Correlation Chart
The statistical analysis conducted on geographies consisting of 354,960,514 people shows a slight negative correlation between the proportion of Immigrants from Eastern Africa and labor force participation rate among population between the ages 30 and 34 in the United States with a correlation coefficient (R) of -0.058 and weighted average of 85.9%. Similarly, the statistical analysis conducted on geographies consisting of 96,336,541 people shows a weak negative correlation between the proportion of Inupiat and labor force participation rate among population between the ages 30 and 34 in the United States with a correlation coefficient (R) of -0.274 and weighted average of 79.7%, a difference of 7.8%.
In Labor Force | Age 30-34 Correlation Summary
| Measurement | Immigrants from Eastern Africa | Inupiat |
| Minimum | 62.7% | 35.7% |
| Maximum | 100.0% | 100.0% |
| Range | 37.3% | 64.3% |
| Mean | 86.5% | 74.7% |
| Median | 86.7% | 78.0% |
| Interquartile 25% (IQ1) | 84.9% | 64.5% |
| Interquartile 75% (IQ3) | 89.6% | 85.7% |
| Interquartile Range (IQR) | 4.6% | 21.3% |
| Standard Deviation (Sample) | 7.2% | 15.1% |
| Standard Deviation (Population) | 7.1% | 15.0% |
Similar Demographics by In Labor Force | Age 30-34
Demographics Similar to Immigrants from Eastern Africa by In Labor Force | Age 30-34
In terms of in labor force | age 30-34, the demographic groups most similar to Immigrants from Eastern Africa are Immigrants from North Macedonia (85.9%, a difference of 0.010%), Immigrants from Eritrea (85.9%, a difference of 0.020%), Immigrants from Liberia (85.9%, a difference of 0.020%), Bermudan (85.9%, a difference of 0.030%), and Estonian (85.9%, a difference of 0.030%).
| Demographics | Rating | Rank | In Labor Force | Age 30-34 |
| Sierra Leoneans | 100.0 /100 | #19 | Exceptional 86.0% |
| Bulgarians | 100.0 /100 | #20 | Exceptional 86.0% |
| Immigrants | Bulgaria | 100.0 /100 | #21 | Exceptional 86.0% |
| Bermudans | 100.0 /100 | #22 | Exceptional 85.9% |
| Estonians | 100.0 /100 | #23 | Exceptional 85.9% |
| Immigrants | Eritrea | 100.0 /100 | #24 | Exceptional 85.9% |
| Immigrants | North Macedonia | 100.0 /100 | #25 | Exceptional 85.9% |
| Immigrants | Eastern Africa | 100.0 /100 | #26 | Exceptional 85.9% |
| Immigrants | Liberia | 100.0 /100 | #27 | Exceptional 85.9% |
| Immigrants | Latvia | 100.0 /100 | #28 | Exceptional 85.9% |
| Tsimshian | 100.0 /100 | #29 | Exceptional 85.8% |
| Immigrants | Hong Kong | 100.0 /100 | #30 | Exceptional 85.8% |
| Paraguayans | 99.9 /100 | #31 | Exceptional 85.8% |
| Cypriots | 99.9 /100 | #32 | Exceptional 85.8% |
| Immigrants | Bosnia and Herzegovina | 99.9 /100 | #33 | Exceptional 85.8% |
Demographics Similar to Inupiat by In Labor Force | Age 30-34
In terms of in labor force | age 30-34, the demographic groups most similar to Inupiat are Kiowa (79.8%, a difference of 0.12%), Houma (79.9%, a difference of 0.22%), Pueblo (80.0%, a difference of 0.40%), Hopi (79.3%, a difference of 0.58%), and Marshallese (79.2%, a difference of 0.62%).
| Demographics | Rating | Rank | In Labor Force | Age 30-34 |
| Seminole | 0.0 /100 | #326 | Tragic 80.8% |
| Colville | 0.0 /100 | #327 | Tragic 80.7% |
| Sioux | 0.0 /100 | #328 | Tragic 80.4% |
| Creek | 0.0 /100 | #329 | Tragic 80.4% |
| Pueblo | 0.0 /100 | #330 | Tragic 80.0% |
| Houma | 0.0 /100 | #331 | Tragic 79.9% |
| Kiowa | 0.0 /100 | #332 | Tragic 79.8% |
| Inupiat | 0.0 /100 | #333 | Tragic 79.7% |
| Hopi | 0.0 /100 | #334 | Tragic 79.3% |
| Marshallese | 0.0 /100 | #335 | Tragic 79.2% |
| Natives/Alaskans | 0.0 /100 | #336 | Tragic 79.2% |
| Yakama | 0.0 /100 | #337 | Tragic 79.1% |
| Pima | 0.0 /100 | #338 | Tragic 79.0% |
| Apache | 0.0 /100 | #339 | Tragic 79.0% |
| Ute | 0.0 /100 | #340 | Tragic 78.9% |