Immigrants from Scotland vs Uruguayan In Labor Force | Age 45-54
COMPARE
Immigrants from Scotland
Uruguayan
In Labor Force | Age 45-54
In Labor Force | Age 45-54 Comparison
Immigrants from Scotland
Uruguayans
83.0%
IN LABOR FORCE | AGE 45-54
77.8/ 100
METRIC RATING
142nd/ 347
METRIC RANK
83.1%
IN LABOR FORCE | AGE 45-54
89.4/ 100
METRIC RATING
121st/ 347
METRIC RANK
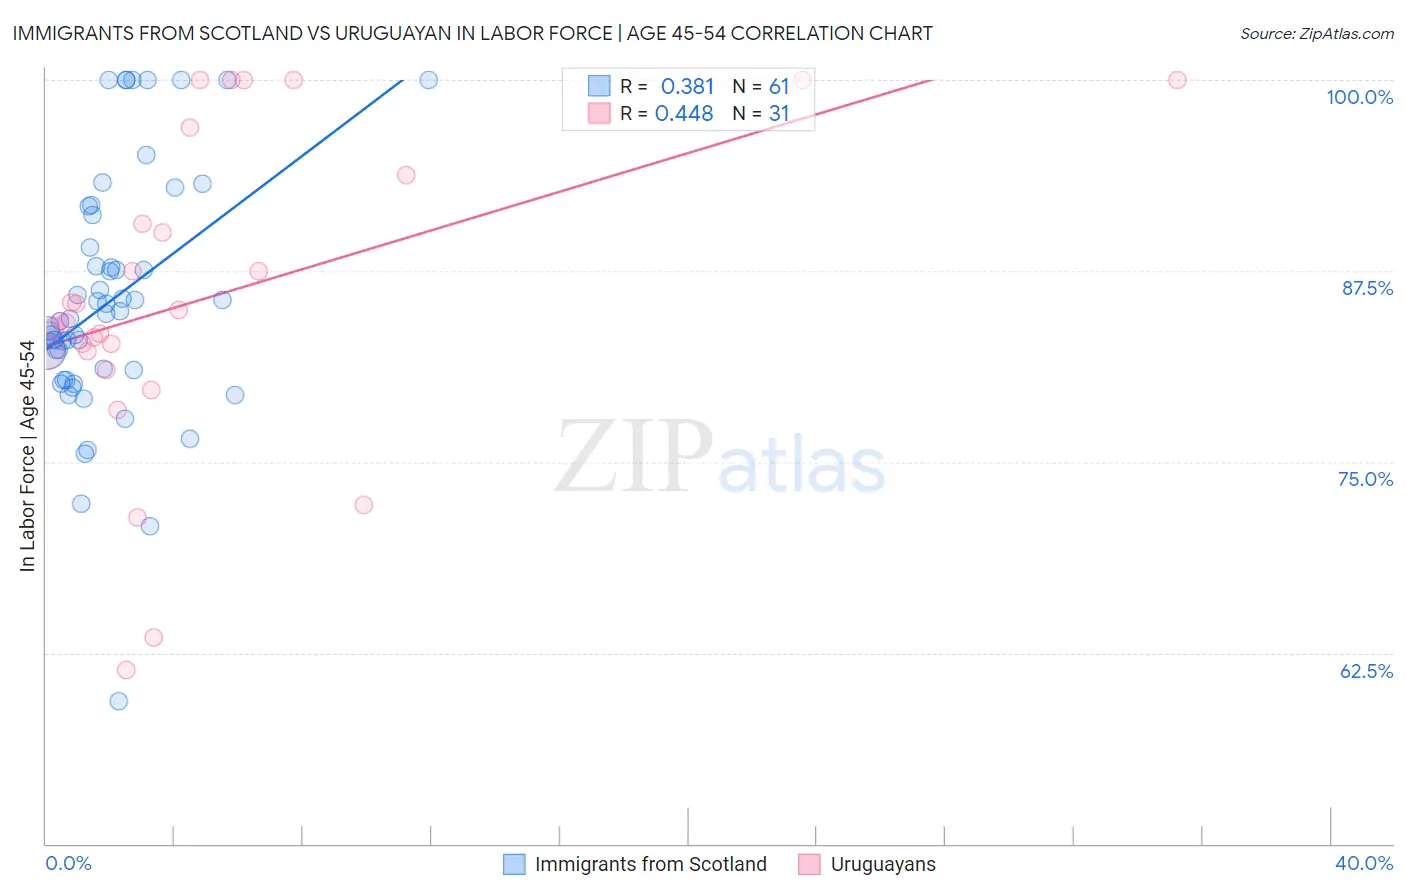
Immigrants from Scotland vs Uruguayan In Labor Force | Age 45-54 Correlation Chart
The statistical analysis conducted on geographies consisting of 196,370,996 people shows a mild positive correlation between the proportion of Immigrants from Scotland and labor force participation rate among population between the ages 45 and 54 in the United States with a correlation coefficient (R) of 0.381 and weighted average of 83.0%. Similarly, the statistical analysis conducted on geographies consisting of 144,763,514 people shows a moderate positive correlation between the proportion of Uruguayans and labor force participation rate among population between the ages 45 and 54 in the United States with a correlation coefficient (R) of 0.448 and weighted average of 83.1%, a difference of 0.19%.
In Labor Force | Age 45-54 Correlation Summary
| Measurement | Immigrants from Scotland | Uruguayan |
| Minimum | 59.3% | 61.4% |
| Maximum | 100.0% | 100.0% |
| Range | 40.7% | 38.6% |
| Mean | 85.6% | 85.7% |
| Median | 84.4% | 84.2% |
| Interquartile 25% (IQ1) | 80.7% | 82.1% |
| Interquartile 75% (IQ3) | 90.1% | 93.8% |
| Interquartile Range (IQR) | 9.4% | 11.7% |
| Standard Deviation (Sample) | 8.1% | 10.2% |
| Standard Deviation (Population) | 8.0% | 10.0% |
Similar Demographics by In Labor Force | Age 45-54
Demographics Similar to Immigrants from Scotland by In Labor Force | Age 45-54
In terms of in labor force | age 45-54, the demographic groups most similar to Immigrants from Scotland are Immigrants from Haiti (83.0%, a difference of 0.0%), Scandinavian (83.0%, a difference of 0.010%), Yugoslavian (83.0%, a difference of 0.010%), Okinawan (83.0%, a difference of 0.010%), and Soviet Union (83.0%, a difference of 0.010%).
| Demographics | Rating | Rank | In Labor Force | Age 45-54 |
| Austrians | 81.3 /100 | #135 | Excellent 83.0% |
| Immigrants | Kazakhstan | 81.0 /100 | #136 | Excellent 83.0% |
| Immigrants | Spain | 80.4 /100 | #137 | Excellent 83.0% |
| Ghanaians | 79.5 /100 | #138 | Good 83.0% |
| Scandinavians | 78.5 /100 | #139 | Good 83.0% |
| Yugoslavians | 78.3 /100 | #140 | Good 83.0% |
| Immigrants | Haiti | 77.9 /100 | #141 | Good 83.0% |
| Immigrants | Scotland | 77.8 /100 | #142 | Good 83.0% |
| Okinawans | 77.0 /100 | #143 | Good 83.0% |
| Soviet Union | 76.8 /100 | #144 | Good 83.0% |
| Romanians | 75.4 /100 | #145 | Good 83.0% |
| Immigrants | France | 75.3 /100 | #146 | Good 83.0% |
| Czechoslovakians | 74.8 /100 | #147 | Good 83.0% |
| Immigrants | Nigeria | 74.1 /100 | #148 | Good 83.0% |
| Immigrants | Sweden | 73.3 /100 | #149 | Good 82.9% |
Demographics Similar to Uruguayans by In Labor Force | Age 45-54
In terms of in labor force | age 45-54, the demographic groups most similar to Uruguayans are Immigrants from Vietnam (83.1%, a difference of 0.010%), Immigrants from Uruguay (83.2%, a difference of 0.020%), Immigrants from Russia (83.2%, a difference of 0.020%), Tongan (83.1%, a difference of 0.020%), and Immigrants from Europe (83.2%, a difference of 0.030%).
| Demographics | Rating | Rank | In Labor Force | Age 45-54 |
| Assyrians/Chaldeans/Syriacs | 91.7 /100 | #114 | Exceptional 83.2% |
| Immigrants | Chile | 91.6 /100 | #115 | Exceptional 83.2% |
| Immigrants | Malaysia | 91.4 /100 | #116 | Exceptional 83.2% |
| Immigrants | China | 90.9 /100 | #117 | Exceptional 83.2% |
| Immigrants | Europe | 90.7 /100 | #118 | Exceptional 83.2% |
| Immigrants | Uruguay | 90.2 /100 | #119 | Exceptional 83.2% |
| Immigrants | Russia | 90.1 /100 | #120 | Exceptional 83.2% |
| Uruguayans | 89.4 /100 | #121 | Excellent 83.1% |
| Immigrants | Vietnam | 88.9 /100 | #122 | Excellent 83.1% |
| Tongans | 88.2 /100 | #123 | Excellent 83.1% |
| Bermudans | 88.0 /100 | #124 | Excellent 83.1% |
| Immigrants | Iran | 87.2 /100 | #125 | Excellent 83.1% |
| Immigrants | Belgium | 86.4 /100 | #126 | Excellent 83.1% |
| Immigrants | Jordan | 85.2 /100 | #127 | Excellent 83.1% |
| Germans | 85.1 /100 | #128 | Excellent 83.1% |