Immigrants from Scotland vs Immigrants from Northern Africa In Labor Force | Age 45-54

COMPARE

Immigrants from Scotland
Race
Ancestry
AfghanAfricanAlaska NativeAlaskan AthabascanAlbanianAleutAlsatianAmericanApacheArabArapahoArgentineanArmenianAssyrian/Chaldean/SyriacAustralianAustrianBahamianBangladeshiBarbadianBasqueBelgianBelizeanBermudanBhutaneseBlackfeetBolivianBrazilianBritishBritish West IndianBulgarianBurmeseCajunCambodianCanadianCape VerdeanCarpatho RusynCelticCentral AmericanCentral American IndianCherokeeCheyenneChickasawChileanChineseChippewaChoctawColombianColvilleComancheCosta RicanCreeCreekCroatianCrowCubanCypriotCzechCzechoslovakianDanishDelawareDominicanDutchDutch West IndianEastern EuropeanEcuadorianEgyptianEnglishEstonianEthiopianEuropeanFijianFilipinoFinnishFrenchFrench American IndianFrench CanadianGermanGerman RussianGhanaianGreekGuamanian/ChamorroGuatemalanGuyaneseHaitianHmongHonduranHopiHoumaHungarianIcelanderIndian (Asian)IndonesianInupiatIranianIraqiIrishIroquoisIsraeliItalianJamaicanJapaneseJordanianKenyanKiowaKoreanLaotianLatvianLebaneseLiberianLithuanianLumbeeLuxembourgerMacedonianMalaysianMalteseMarshalleseMenomineeMexicanMexican American IndianMongolianMoroccanNative HawaiianNavajoNepaleseNew ZealanderNicaraguanNigerianNorthern EuropeanNorwegianOkinawanOsageOttawaPaiutePakistaniPalestinianPanamanianParaguayanPennsylvania GermanPeruvianPimaPolishPortuguesePotawatomiPuebloPuerto RicanPuget Sound SalishRomanianRussianSalvadoranSamoanScandinavianScotch-IrishScottishSeminoleSenegaleseSerbianShoshoneSierra LeoneanSiouxSlavicSlovakSloveneSomaliSouth AfricanSouth AmericanSouth American IndianSoviet UnionSpaniardSpanishSpanish AmericanSpanish American IndianSri LankanSubsaharan AfricanSudaneseSwedishSwissSyrianTaiwaneseThaiTlingit-HaidaTohono O'OdhamTonganTrinidadian and TobagonianTsimshianTurkishU.S. Virgin IslanderUgandanUkrainianUruguayanUteVenezuelanVietnameseWelshWest IndianYakamaYaquiYugoslavianYumanYup'ikZimbabwean
Immigration
NonimmigrantsImmigrantsAfghanistanAfricaAlbaniaArgentinaArmeniaAsiaAustraliaAustriaBahamasBangladeshBarbadosBelarusBelgiumBelizeBoliviaBosnia and HerzegovinaBrazilBulgariaBurma/MyanmarCabo VerdeCambodiaCameroonCanadaCaribbeanCentral AmericaChileChinaColombiaCongoCosta RicaCroatiaCubaCzechoslovakiaDenmarkDominicaDominican RepublicEastern AfricaEastern AsiaEastern EuropeEcuadorEgyptEl SalvadorEnglandEritreaEthiopiaEuropeFijiFranceGermanyGhanaGreeceGrenadaGuatemalaGuyanaHaitiHondurasHong KongHungaryIndiaIndonesiaIranIraqIrelandIsraelItalyJamaicaJapanJordanKazakhstanKenyaKoreaKuwaitLaosLatin AmericaLatviaLebanonLiberiaLithuaniaMalaysiaMexicoMicronesiaMiddle AfricaMoldovaMoroccoNepalNetherlandsNicaraguaNigeriaNorth AmericaNorth MacedoniaNorthern EuropeNorwayOceaniaPakistanPanamaPeruPhilippinesPolandPortugalRomaniaRussiaSaudi ArabiaScotlandSenegalSerbiaSierra LeoneSingaporeSomaliaSouth AfricaSouth AmericaSouth Central AsiaSouth Eastern AsiaSouthern EuropeSpainSri LankaSt. Vincent and the GrenadinesSudanSwedenSwitzerlandSyriaTaiwanThailandTrinidad and TobagoTurkeyUgandaUkraineUruguayUzbekistanVenezuelaVietnamWest IndiesWestern AfricaWestern AsiaWestern EuropeYemenZaireZimbabweAzores
Immigrants from Northern Africa
Race
Ancestry
AfghanAfricanAlaska NativeAlaskan AthabascanAlbanianAleutAlsatianAmericanApacheArabArapahoArgentineanArmenianAssyrian/Chaldean/SyriacAustralianAustrianBahamianBangladeshiBarbadianBasqueBelgianBelizeanBermudanBhutaneseBlackfeetBolivianBrazilianBritishBritish West IndianBulgarianBurmeseCajunCambodianCanadianCape VerdeanCarpatho RusynCelticCentral AmericanCentral American IndianCherokeeCheyenneChickasawChileanChineseChippewaChoctawColombianColvilleComancheCosta RicanCreeCreekCroatianCrowCubanCypriotCzechCzechoslovakianDanishDelawareDominicanDutchDutch West IndianEastern EuropeanEcuadorianEgyptianEnglishEstonianEthiopianEuropeanFijianFilipinoFinnishFrenchFrench American IndianFrench CanadianGermanGerman RussianGhanaianGreekGuamanian/ChamorroGuatemalanGuyaneseHaitianHmongHonduranHopiHoumaHungarianIcelanderIndian (Asian)IndonesianInupiatIranianIraqiIrishIroquoisIsraeliItalianJamaicanJapaneseJordanianKenyanKiowaKoreanLaotianLatvianLebaneseLiberianLithuanianLumbeeLuxembourgerMacedonianMalaysianMalteseMarshalleseMenomineeMexicanMexican American IndianMongolianMoroccanNative HawaiianNavajoNepaleseNew ZealanderNicaraguanNigerianNorthern EuropeanNorwegianOkinawanOsageOttawaPaiutePakistaniPalestinianPanamanianParaguayanPennsylvania GermanPeruvianPimaPolishPortuguesePotawatomiPuebloPuerto RicanPuget Sound SalishRomanianRussianSalvadoranSamoanScandinavianScotch-IrishScottishSeminoleSenegaleseSerbianShoshoneSierra LeoneanSiouxSlavicSlovakSloveneSomaliSouth AfricanSouth AmericanSouth American IndianSoviet UnionSpaniardSpanishSpanish AmericanSpanish American IndianSri LankanSubsaharan AfricanSudaneseSwedishSwissSyrianTaiwaneseThaiTlingit-HaidaTohono O'OdhamTonganTrinidadian and TobagonianTsimshianTurkishU.S. Virgin IslanderUgandanUkrainianUruguayanUteVenezuelanVietnameseWelshWest IndianYakamaYaquiYugoslavianYumanYup'ikZimbabwean
Immigration
NonimmigrantsImmigrantsAfghanistanAfricaAlbaniaArgentinaArmeniaAsiaAustraliaAustriaBahamasBangladeshBarbadosBelarusBelgiumBelizeBoliviaBosnia and HerzegovinaBrazilBulgariaBurma/MyanmarCabo VerdeCambodiaCameroonCanadaCaribbeanCentral AmericaChileChinaColombiaCongoCosta RicaCroatiaCubaCzechoslovakiaDenmarkDominicaDominican RepublicEastern AfricaEastern AsiaEastern EuropeEcuadorEgyptEl SalvadorEnglandEritreaEthiopiaEuropeFijiFranceGermanyGhanaGreeceGrenadaGuatemalaGuyanaHaitiHondurasHong KongHungaryIndiaIndonesiaIranIraqIrelandIsraelItalyJamaicaJapanJordanKazakhstanKenyaKoreaKuwaitLaosLatin AmericaLatviaLebanonLiberiaLithuaniaMalaysiaMexicoMicronesiaMiddle AfricaMoldovaMoroccoNepalNetherlandsNicaraguaNigeriaNorth AmericaNorth MacedoniaNorthern AfricaNorthern EuropeNorwayOceaniaPakistanPanamaPeruPhilippinesPolandPortugalRomaniaRussiaSaudi ArabiaSenegalSerbiaSierra LeoneSingaporeSomaliaSouth AfricaSouth AmericaSouth Central AsiaSouth Eastern AsiaSouthern EuropeSpainSri LankaSt. Vincent and the GrenadinesSudanSwedenSwitzerlandSyriaTaiwanThailandTrinidad and TobagoTurkeyUgandaUkraineUruguayUzbekistanVenezuelaVietnamWest IndiesWestern AfricaWestern AsiaWestern EuropeYemenZaireZimbabweAzores
In Labor Force | Age 45-54
Income
Poverty
Unemployment
Labor Participation
Family Structure
Vehicle Availability
Education Level
Disability

In Labor Force | Age 45-54 Comparison

Immigrants from Scotland

Immigrants from Northern Africa

Good
Exceptional
83.0%
IN LABOR FORCE | AGE 45-54
77.8/ 100
METRIC RATING
142nd/ 347
METRIC RANK
83.3%
IN LABOR FORCE | AGE 45-54
95.7/ 100
METRIC RATING
86th/ 347
METRIC RANK

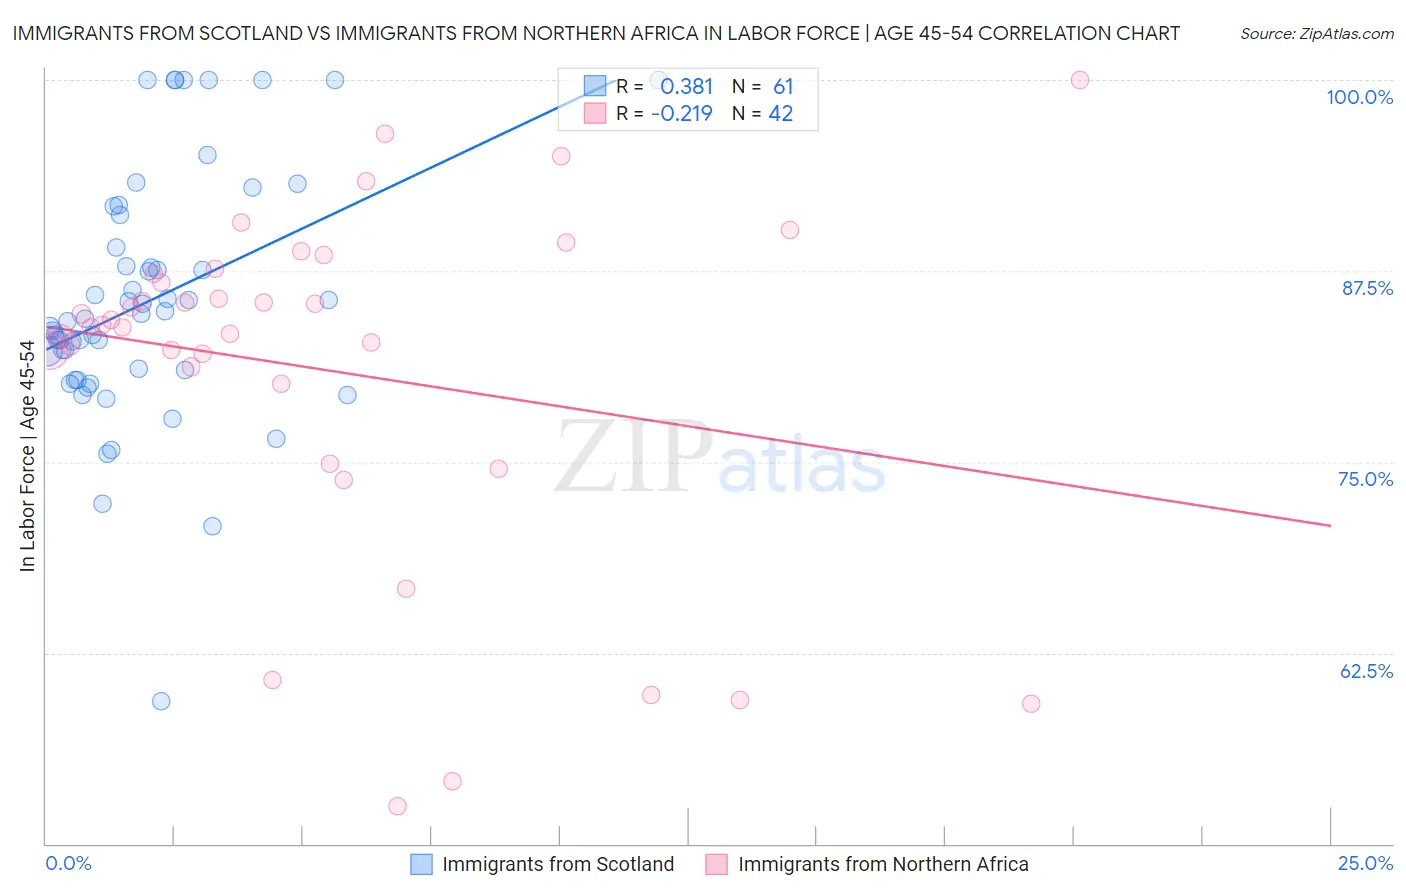
Immigrants from Scotland vs Immigrants from Northern Africa In Labor Force | Age 45-54 Correlation Chart

The statistical analysis conducted on geographies consisting of 196,370,996 people shows a mild positive correlation between the proportion of Immigrants from Scotland and labor force participation rate among population between the ages 45 and 54 in the United States with a correlation coefficient (R) of 0.381 and weighted average of 83.0%. Similarly, the statistical analysis conducted on geographies consisting of 321,062,040 people shows a weak negative correlation between the proportion of Immigrants from Northern Africa and labor force participation rate among population between the ages 45 and 54 in the United States with a correlation coefficient (R) of -0.219 and weighted average of 83.3%, a difference of 0.40%.
Immigrants from Scotland vs Immigrants from Northern Africa In Labor Force | Age 45-54

In Labor Force | Age 45-54 Correlation Summary

MeasurementImmigrants from ScotlandImmigrants from Northern Africa
Minimum59.3%52.4%
Maximum100.0%100.0%
Range40.7%47.6%
Mean85.6%81.0%
Median84.4%83.9%
Interquartile 25% (IQ1)80.7%80.1%
Interquartile 75% (IQ3)90.1%87.3%
Interquartile Range (IQR)9.4%7.2%
Standard Deviation (Sample)8.1%11.4%
Standard Deviation (Population)8.0%11.2%

Similar Demographics by In Labor Force | Age 45-54

Demographics Similar to Immigrants from Scotland by In Labor Force | Age 45-54

In terms of in labor force | age 45-54, the demographic groups most similar to Immigrants from Scotland are Immigrants from Haiti (83.0%, a difference of 0.0%), Scandinavian (83.0%, a difference of 0.010%), Yugoslavian (83.0%, a difference of 0.010%), Okinawan (83.0%, a difference of 0.010%), and Soviet Union (83.0%, a difference of 0.010%).
DemographicsRating | RankIn Labor Force | Age 45-54
Austrians
81.3
/100
|
#135
Excellent
83.0%
Immigrants | Kazakhstan
81.0
/100
|
#136
Excellent
83.0%
Immigrants | Spain
80.4
/100
|
#137
Excellent
83.0%
Ghanaians
79.5
/100
|
#138
Good
83.0%
Scandinavians
78.5
/100
|
#139
Good
83.0%
Yugoslavians
78.3
/100
|
#140
Good
83.0%
Immigrants | Haiti
77.9
/100
|
#141
Good
83.0%
Immigrants | Scotland
77.8
/100
|
#142
Good
83.0%
Okinawans
77.0
/100
|
#143
Good
83.0%
Soviet Union
76.8
/100
|
#144
Good
83.0%
Romanians
75.4
/100
|
#145
Good
83.0%
Immigrants | France
75.3
/100
|
#146
Good
83.0%
Czechoslovakians
74.8
/100
|
#147
Good
83.0%
Immigrants | Nigeria
74.1
/100
|
#148
Good
83.0%
Immigrants | Sweden
73.3
/100
|
#149
Good
82.9%

Demographics Similar to Immigrants from Northern Africa by In Labor Force | Age 45-54

In terms of in labor force | age 45-54, the demographic groups most similar to Immigrants from Northern Africa are Immigrants from Eastern Europe (83.3%, a difference of 0.0%), Greek (83.3%, a difference of 0.010%), Immigrants from Asia (83.3%, a difference of 0.010%), Indian (Asian) (83.3%, a difference of 0.010%), and Immigrants from Japan (83.3%, a difference of 0.010%).
DemographicsRating | RankIn Labor Force | Age 45-54
Belgians
96.5
/100
|
#79
Exceptional
83.4%
Immigrants | Croatia
96.5
/100
|
#80
Exceptional
83.4%
Jordanians
96.4
/100
|
#81
Exceptional
83.4%
Immigrants | Eastern Asia
96.3
/100
|
#82
Exceptional
83.4%
Immigrants | Zimbabwe
96.3
/100
|
#83
Exceptional
83.4%
Immigrants | Bosnia and Herzegovina
96.0
/100
|
#84
Exceptional
83.3%
Greeks
95.9
/100
|
#85
Exceptional
83.3%
Immigrants | Northern Africa
95.7
/100
|
#86
Exceptional
83.3%
Immigrants | Eastern Europe
95.6
/100
|
#87
Exceptional
83.3%
Immigrants | Asia
95.6
/100
|
#88
Exceptional
83.3%
Indians (Asian)
95.5
/100
|
#89
Exceptional
83.3%
Immigrants | Japan
95.5
/100
|
#90
Exceptional
83.3%
South Americans
95.5
/100
|
#91
Exceptional
83.3%
Danes
95.3
/100
|
#92
Exceptional
83.3%
Italians
95.1
/100
|
#93
Exceptional
83.3%